Operations | Monitoring | ITSM | DevOps | Cloud
Latest News
Digital Transformation: Strategies for Success from Top Tier Enterprises
In our last post on Catchpoint’s 2020 CIO New Normal Survey we talked about how COVID-19 is driving a “reverse industrial revolution” that is fueling a mass exodus from America’s biggest (and most expensive) cities. This week, we focus on a more pragmatic set of findings: the IT lessons that we can learn from those American enterprises that have fared the best during the COVID-19 pandemic.
SRE + Honeycomb: Observability for Service Reliability
As a Customer Advocate, I talk to a lot of prospective Honeycomb users who want to understand how observability fits into their existing Site Reliability Engineering (SRE) practice. While I have enough of a familiarity with the discipline to get myself into trouble, I wanted to learn more about what SREs do in their day-to-day work so that I’d be better able to help them determine if Honeycomb is a good fit for their needs.
Automate Elastic Cloud workflows using an SDK and Elasticsearch Service API
We recently announced the general availability of our Elasticsearch Service API. APIs help to automate tasks such as creating and scaling deployments, integrating with existing workflows, and testing. The Elasticsearch Service API supports the Open API Specification, which allows you to use tools like Swagger to generate software development kits (SDKs) in any programming language. You can import the API spec onto Postman and create a Postman Collection to create a test suite.
The Go client for Elasticsearch: Configuration and customization
In a previous blog, we saw that the seemingly simple job of an Elasticsearch client — moving data between the calling code and the cluster — is actually quite complicated under the hood. Naturally, as much as we try to make the default behaviour of the client optimal for the majority of scenarios, there are situations where you want to configure, customize, or enable/disable certain features.
OpsRamp Forges New Partnership with Google Cloud
Google Cloud is growing marketplace traction with enterprise customers as an innovative, service-rich option for multi-cloud environments. The public cloud platform, known to be a developer’s favorite, has solutions by industry and comprehensive offerings in artificial intelligence, analytics, DevOps and high-performance computing among others. Today, OpsRamp announced a partnership with Google to bring hybrid discovery, monitoring, and automation to Google Cloud customers and partners.
Subnetting: What it is and How it Works
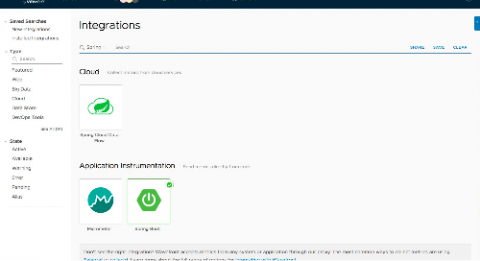
Instant Insights for Troubleshooting Your Spring Boot Applications and Spring Cloud Data Flow Pipelines
Looking for a way to proactively troubleshoot complex application performance issues? Look no further than Tanzu Observability by Wavefront, which provides easy data ingestion and preconfigured dashboards and can be set up with Spring Boot and Spring Cloud Data Flow (SCDF) integrations.
Community Highlight: How InfluxDB Enables IoT Sensor Monitoring of Aquariums
I recently spoke with Jeremy White who is using InfluxDB to monitor his aquariums. By collecting IoT sensor data, he has been able to better understand his 200 gallon salt-water aquarium full of fish and coral. The entire project can be found on GitHub. Caitlin: Tell us about yourself and your career. Jeremy: I’m a Senior Network Automation Consultant at Network to Code, and my background is in networking engineering. Network to Code is an industry leader in network automation.
The Core Enterprise Security Team Has Been Very Busy
Okay... and we’re back! Yes, there’s been a bit of a hiatus since you’ve heard from us in Core Security, but that’s not because we haven’t been busy. In fact, we’ve released a number of enhancements for both the security and user administration experiences of Splunk Enterprise. Going forward, we’ll be a bit more visible bringing you details on these enhancements.


