Operations | Monitoring | ITSM | DevOps | Cloud

Latest News

Logging Kubernetes on GKE with the ELK Stack and Logz.io

An important element of operating Kubernetes is monitoring. Hosted Kubernetes services simplify the deployment and management of clusters, but the task of setting up logging and monitoring is mostly up to us. Yes, Kubernetes offer built-in monitoring plumbing, making it easier to ship logs to either Stackdriver or the ELK Stack, but these two endpoints, as well as the data pipeline itself, still need to be set up and configured.

How to Monitor Amazon Elastic Load Balancing with CloudWatch

Amazon Elastic Load Balancing ( ELB ) allows you to create load balancers for your application without having to actually manage the servers that do the load balancing. However, since it’s a managed service, you have less visibility with traditional monitoring tools. As such, it becomes even more important to take advantage of the available monitoring tools in AWS. In this post, we’ll explain how to use CloudWatch to monitor Elastic Load Balancing and what is important to watch.

Monitoring StatsD: metric types, format & code examples

The StatsD stack is one of the most popular monitoring solutions to instrument your code using custom metrics. In this post we will describe the StatsD metrics architecture, metrics types and formats, proving code examples for the Golang, NodeJS/Javascript and Python programming languages.

What is Azure Automation?

As Microsoft Azure continues to be developed and more automation options become available; Azure Automation, Logic Apps, ARM (Azure Resource Manager) and Azure Function Apps to name a few, the question is quickly turning from ‘how do I automate with Azure?’ to ‘what automation type do I use in Azure?’. Across our next few blogs we will seek to delve into the options available and look to define how they stack up against Azure Automation.

Shadow Like A Dutonian: Onboarding Engineers With On-Call Shadowing

On-call shadowing is an essential practice at PagerDuty. For a new engineer, a shadowing period serves as a kinder, smoother ramp-up to going on-call, with none of the stress or responsibility for diagnosing and fixing the issue. When we configure shadowing in PagerDuty, our goal is to simulate the process and actions of going on call as precisely as we can while making sure that actions of the “Shadow User” do not affect the primary engineer who is actually on call.

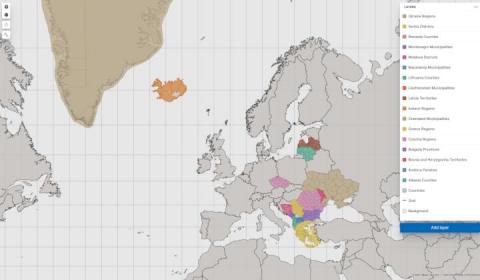
The use and importance of Maps in Monitoring

Maps have been related to the management and monitoring activities of IT platforms for a long time. Years ago, when there were no tools available to generate the graphical vision we call maps, the documentation of the device that made up the platform was usually carried in tables and diagrams where the existence of the components, their characteristics and relationships were recorded.

How to test serverless applications

Like any other creation in progress or in the making, serverless applications, need to be tested and monitored. How else would you know if what you’ve created is providing desired results? Before putting your “newborn child” out into the world, you must make sure that it’s ready for the world. Software or even hardware of any sort will first be tested before it goes to mass production, and the same goes for your serverless applications.

Tuning Jaeger's performance

Jaeger was built from day 1 to be able to ingest huge amounts of data in a resilient way. To better utilize resources that might cause delays, such as storage or network communications, Jaeger buffers and batches data. When more spans are generated than Jaeger is able to safely process, spans might get dropped. However, the defaults might not fit all scenarios: for instance, agents running as a sidecar might have more memory constraints than agents running as a daemon in bare metal.