Operations | Monitoring | ITSM | DevOps | Cloud
Monitoring
The latest News and Information on Monitoring for Websites, Applications, APIs, Infrastructure, and other technologies.
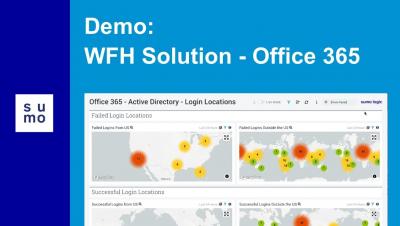
Work From Home Solution: Office 365
Getting started with Grafana Loki on Google Kubernetes Engine - under 5 minutes.
Unpacking Events: All the Better to Observe
At Honeycomb, we’ve been listening to your feedback. You want easier ways to predict usage and scale your observability spend with your business. What would it look like to meet you where you already are, using similar terms, and give you more control with a simpler experience? We think that means reimagining the customer experience into one that centers around an event-based model. But what exactly is an event? What does that mean for your team’s observability journey?
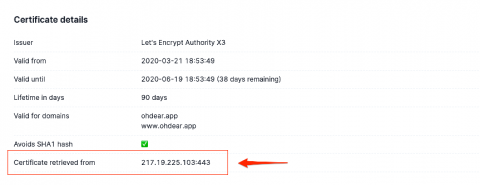
How Oh Dear identified a certificate problem at a large CDN provider
As part of our service, we perform SSL certificate monitoring. We do this slightly different than other providers, which is why were able to detect a problem with the SSL certificates of a large, commercial, CDN provider. In this post, we'll do a technical deep-dive into how we found this problem!
Free AIOps and Remote Access with OpsRamp's Infrastructure Discovery & Monitoring
We realize that many companies are facing tighter technology budgets right now, yet at the same time IT needs are unrelenting. From supporting remote workforce continuity and productivity to partnering with business leaders on redesigning products and services during the Covid-19 pandemic, IT organizations have some pretty heavy mandates right now.
How LineMetrics Uses InfluxDB to Launch Its IoT Monitoring Platform
“What would it be like to have an asset monitoring solution that can be installed within minutes and is independent of all existing IT systems, without endangering existing processes?” LineMetrics was founded in 2012 in Haag, Austria, in response to questions just like this one. LineMetrics developed a complete real-time asset monitoring solution delivered through its end-to-end Internet of Things (IoT) platform.
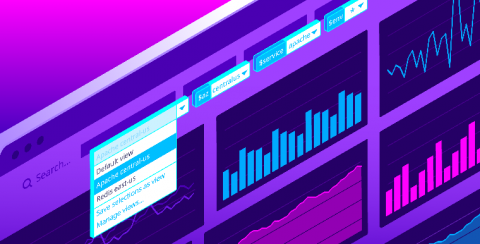
Introducing template variable saved views for dashboards
Datadog dashboards provide immediate visibility and insight into your environments. Setting template variables enables you to filter your dashboard graphs on the fly to visualize specific sets of tagged objects. Now, with saved views, you can save sets of frequently used template variables in order to easily find the data you most care about with just a few clicks.
How to Create Cost-Effective Infrastructure Monitoring
Out of the box monitoring solutions are getting more and more difficult to implement. In addition, they may not have the features you need, and they’re always becoming more expensive. It’s no wonder you’re trying to create a cost-effective solution via infrastructure monitoring cost management on your own by using a combination of your on-site development talent and a few open-source libraries.
Challenges Monitoring ReactJS Applications
ReactJS combines the speed of JavaScript with unique rendering capabilities to make applications that are highly dynamic, performance oriented, and responsive to user input. State of JS report 2018 cites performance as the major reason ReactJS has gained so much popularity in such a short time. When it comes to options for building single-page applications (SPAs), React delivers performance advantages over Angular and other JavaScript frameworks and libraries.


