Operations | Monitoring | ITSM | DevOps | Cloud
Monitoring
The latest News and Information on Monitoring for Websites, Applications, APIs, Infrastructure, and other technologies.
Installing the Auvik Windows collector
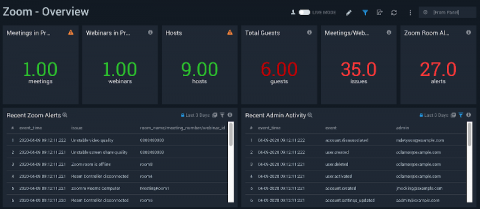
Ensure a secure and reliable Zoom video conferencing service
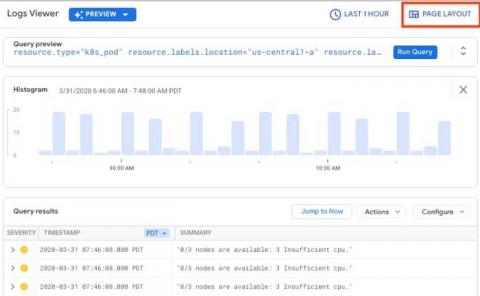
Find and fix issues faster with our new Logs Viewer
Monitoring your cloud infrastructure is an essential part of making sure your operations are running smoothly. Since announcing the new Cloud Logging interface in February, we’ve heard from users that the new interface is making it faster and easier to meet logging needs, including troubleshooting issues, verifying deployments, and ensuring compliance. One of those users, Arne Claus, is a site reliability engineer at trivago, and has taken advantage of the new interface already.
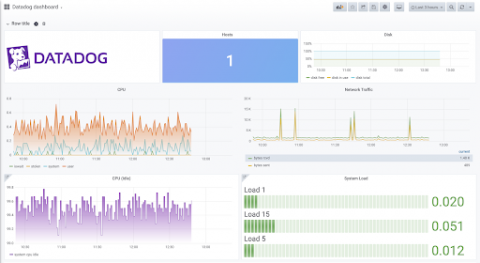
Pro tips for making the most of your Datadog metrics in Grafana with the enterprise plugin
Hello again! We are Eldin and Christine – or, as our lovely editor has dubbed us, Regis and Kelly – jumping back in for another post. This week, to highlight the big tent and community theme, we are going to write about how our Datadog plugin allows you to “see it all in one place.” Datadog is a popular monitoring and analytics platform that allows you to easily install an agent so you can get started with collecting metrics right away.
Logz.io Infrastructure Monitoring: Grafana and Kibana are Better Together
In the midst of a complex and challenging global environment, I’m proud and excited to announce General Availability for Logz.io Infrastructure Monitoring, our new metrics monitoring and analytics solution based on Grafana. Additionally, we’re supporting Early Availability for our new Distributed Tracing offering powered by Jaeger. The release represents a huge next step in our mission to provide the best open source for observability as a fully managed, cost-effective cloud service.
Basic Concepts | Pandora FMS
How to Troubleshoot Home Office Performance Issues
Launching Websites Rapidly, Without Compromise
In the past few weeks, financial firms and governments have had to build and launch websites in a hurry — for a multitude of reasons including the emergency loan programmes that have been backed by various governments around the world including the USA and Europe.


