Operations | Monitoring | ITSM | DevOps | Cloud

%term

What is Endpoint Monitoring? Definitions, Benefits & Best Practices

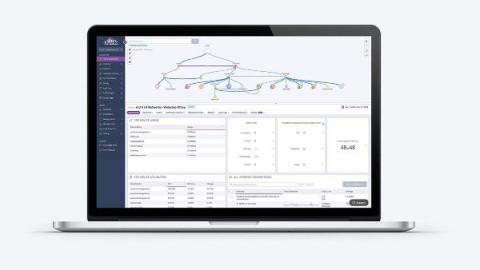
Endpoints are a prime target for threat actors. In fact, 68% of the respondents to a Ponenmon study reported experiencing an endpoint attack that successfully compromised data or IT infrastructure. And, with IBM pegging the average cost of a data breach at $4.88 million USD, it’s clear that effective endpoint monitoring and security is a key objective for organizations of all sizes. As the stakes for endpoint security increase, so does the complexity.

What is Endpoint Detection and Response (EDR) Software?

Organizations are rapidly adopting endpoint detection and response software to address the challenge and strengthen their overall network infrastructure security. Why? In large part because endpoints are used by the weakest link in the cybersecurity chain (humans!) and therefore create business risk. Endpoint devices typically have internet access, can reach sensitive internal data, and are primarily used by people who aren’t cybersecurity professionals.

Use Datadog App Builder to peak, purge, or redrive AWS SQS.

This video aims to showcase how developers can self-serve from an application to simplify the management of their AWS cloud resources. Rather than switching between tools or reaching out to another team for help, developers can take action directly from their observability tool, enabling faster resolution of application issues. We will demonstrate how to build a simple app that allows them to minimize disruptions by quickly taking action on their SQS queues in AWS, using insights provided by Datadog.

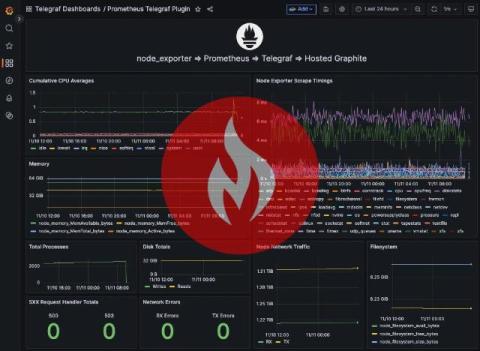
Simple Guide to Converting Prometheus Metrics to Graphite Using Telegraf

Monitoring with Graphite is often easier than with Prometheus because it uses a simple, hierarchical naming system that's intuitive to manage. Its storage model is also designed for long-term data retention without complex setups, which is perfect when historical data matters. By converting Prometheus metrics to Graphite, you streamline your monitoring to one consistent format, reducing the hassle of juggling multiple systems.

VictoriaMetrics Anomaly Detection: What's New in Q3 2024?

With this blog post, we continue our quarterly “What’s New” series to inform a broader audience about the latest features and improvements made to VictoriaMetrics Anomaly Detection (or simply vmanomaly). This post covers Q3'24 progress along with early Q4 to accommodate a slight shift in the publishing schedule — why not take advantage of it? Stay tuned for upcoming content on anomaly detection.

Transforming Network Operations: Why RAN Automation is Essential for the Future

With the shift toward 5G and the forthcoming 6G evolution, Network Operations Centers (NOCs) are under increasing pressure to keep up with the complexities of modern telecommunications. At the heart of this evolution is the Radio Access Network (RAN), which has developed from supporting basic voice services to enabling the high-speed, low-latency networks essential for IoT, smart cities, and autonomous vehicles.

Enhancing Data Flexibility in Microsoft Sentinel with Cribl

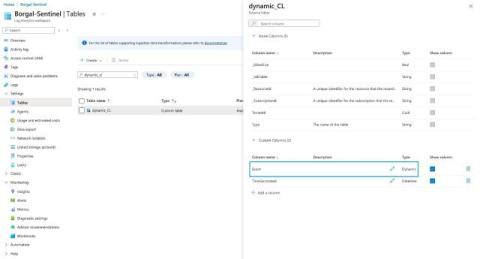
At Cribl, we’ve been deeply investing in the Microsft Azure security space. Last year, we introduced a native integration with Microsoft Sentinel, enabling us to write data seamlessly to native and custom tables. As highlighted earlier, working with Microsoft Sentinel and Log Analytics involves interacting with tables with predefined column names and data types.

Monitor Azure AI Search with Datadog

Azure AI Search is Microsoft Azure’s managed search service. In addition to tackling traditional search use cases, Azure AI Search also includes AI-powered features to make it a fully capable document catalog, search engine, and vector database. AI Search is highly interoperable—it can use models created in Azure OpenAI Service, Azure AI Studio, or Azure ML.