Operations | Monitoring | ITSM | DevOps | Cloud

Product Release

Set and scale service level objectives in Grafana Cloud: Introducing Grafana SLO

When we began offering Grafana Cloud Metrics, we set a service level agreement (SLA) for 99.5% of requests to be completed within a few seconds. So we built an alert that would go off if more than 0.5% of requests were slower than a couple of seconds within a five-minute moving window. Sounds reasonable, right?

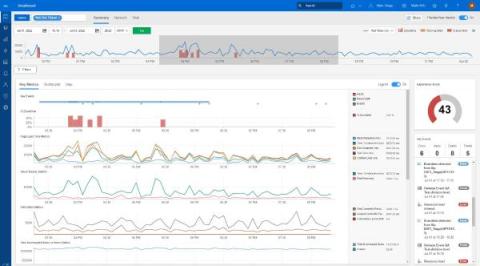
The Future of Operations: AI-powered Internet Performance Monitoring

At Catchpoint, our philosophy is that AI should not be adopted simply for the sake of AI itself. Instead, it should be embraced when it proves to be the most effective solution for addressing a particular business challenge. While the world is currently in the fervor of the oncoming AI revolution, our industry-leading IPM platform has quietly harnessed the potential of Artificial Intelligence for years.

Not Every Problem is an Error: Introducing Rage and Dead Clicks + New User Feedback Reports

I know, we’re Sentry the error and performance monitoring platform and we catch production issues. But as you (hopefully) saw during our Launch Week announcement, some broken experiences simply won’t throw an exception. So we built a way to detect when your users are slamming their keys on the keyboard in frustration, and to even let them contact you directly when that doesn’t go their way.

Manage log volumes, metrics cardinality, monthly bills: Explore Grafana Cloud cost management tools

As more organizations adopt observability at massive scale, they have also been grappling with rising costs. Over the past 12 months, we have been working on different solutions to help our users better understand and manage their observability stack, not to mention the bills that come with scaling it.

OnPage Releases Healthcare-Focused Slack Integration

In the healthcare realm, the need for communication platforms that meet HIPAA standards is undeniable. Enter Slack, a popular collaboration platform armed with robust security features. However, the real game-changer emerges through the integration with OnPage. This isn’t just an upgrade in collaboration; it’s a transformative shift in critical communication within healthcare—a field where every moment counts.

Introducing the Notification API

You'll often hear us saying "everyone loves a dashboard", and that's most certainly true, but nobody loves staring at a screen all day waiting for something to happen. Real magic is when your awesome dashboard comes to you, where you need it, when you need it. Over the last few months we've introduced a bunch of powerful features to make "taking action" as simple as possible... Monitors let you define the health of your data so you can see at a glance if something isn't right.

Captains Log: A first look at our architecture for Signals

Welcome to the first Signals Captain’s Log! My name is Robert, and I’m a recovering on-call engineer and the CEO of FireHydrant. When we started our journey of building Signals, a viable replacement for PagerDuty, OpsGenie, etc, we decided very early that we would tell everyone what makes Signals unique, and what better way than to tell you how we’re building it (without revealing too much 😉). Let’s jump in.

Unveiling Endpoint Central MSP Cloud: Your complete SaaS client endpoint management solution

We’re thrilled to announce the release of Endpoint Central MSP Cloud, a game-changing solution for MSPs like you. In today’s tech-driven world, managing and securing client endpoints is a critical aspect of the SLAs between MSPs and their clients. That’s why we’re excited to introduce the cloud version of Endpoint Central MSP. With the cloud version of Endpoint Central MSP, you’ll experience a new level of endpoint management efficiency.