Operations | Monitoring | ITSM | DevOps | Cloud

Product Release

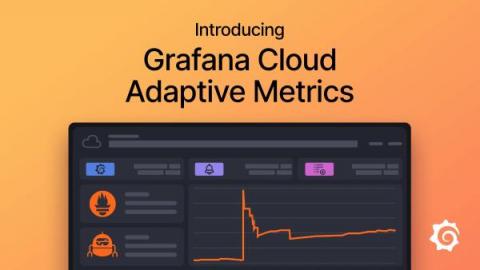
Introducing Adaptive Metrics: A new cost management feature in Grafana Cloud

You’ve convinced your organization that cloud native is the way forward. You’ve championed Kubernetes and sworn by Prometheus. You’ve onboarded multiple teams to your centralized observability platform. Then you open your latest bill and see a lot of commas in your invoice, and a sinking feeling sets in. Sound familiar? We’re keenly aware of the pain this can bring. As metric cardinality grows in cloud native environments, so does the cost to store and retrieve the data.

Announcing Checkly CLI GA and Test Sessions Beta

Today the Checkly CLI is generally available. Together with its companion — the new test sessions screen (in beta) — this marks a big milestone for us at Checkly and our users. We already talked about monitoring as code and the CLI during its alpha and beta testing phases but here is a short recap. With the Checkly CLI you have the most powerful monitoring as code workflow at your fingertips.

Introducing Rollbar Analyze

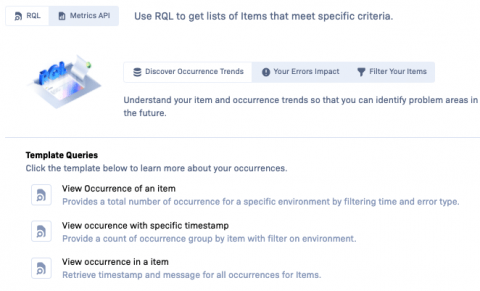
We are excited to announce the rollout of our new Rollbar Improve component, Analyze. As we strive to provide you with the best possible tools to monitor, understand, and improve your code, we've combined two powerful features, RQL and Metrics API, into one comprehensive package. Analyze is designed to deliver even more powerful insights to help your teams better understand your code and make data-driven decisions.

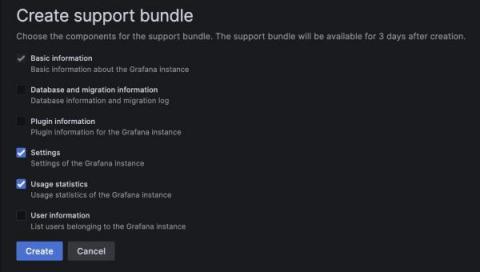
New in Grafana 9.5: Debug Grafana instances faster with support bundles

With the arrival of Grafana 9.5, we’re excited to introduce Grafana support bundles — a tool to help debug your Grafana instance faster and more easily. Support bundles provide a simple way to gather and share information about your Grafana instance, and this feature is available across all tiers in Grafana Cloud as well as in Grafana OSS and Grafana Enterprise.

Grafana Agent v0.33 release: reusable pipelines, monitoring Kubernetes pods, and more

Grafana Agent v0.33 is here! This new release includes a lot of exciting features, such as a powerful way to configure Grafana Agent with Flow Modules and the ability to monitor Kubernetes pods in your cluster with an Operator Flow component. We also added many more Flow components making the Flow ecosystem bigger!

Enhanced Security, Improved Performance Reporting with DX UIM 20.4 Cumulative Update 7

In today's fast-paced digital world, keeping up with the latest technology advancements is crucial for businesses to stay ahead of the competition. This is especially true in the world of IT infrastructure management, where technology is rapidly evolving and new solutions are being developed to meet the changing needs of businesses.

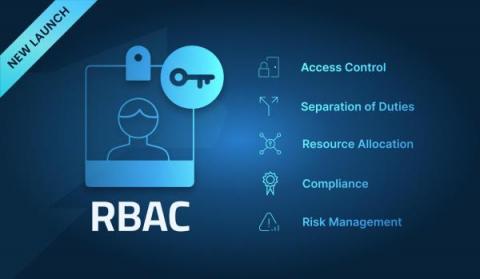
Lightrun Bolsters Security Measures with Role-Based Access Control (RBAC)

Lightrun enhances its enterprise-grade platform with the addition of RBAC support to ensure that only authorized users have access to sensitive information and resources as they troubleshoot their live applications. By using Lightrun’s RBAC solution, organizations can create a centralized system for managing user permissions and access rights, making it easier to enforce security policies and prevent security breaches.