Operations | Monitoring | ITSM | DevOps | Cloud

Dashboards

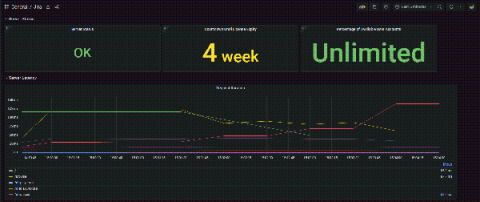
How to set up synthetic monitoring at scale with Grafana Cloud

While unit testing and integration testing can give you insight into the individual functionalities of an application, “at times you need some sort of monitoring or testing mechanism which also simulates a user’s behavior to test how the application would work or look to an actual user in the world,” says Grofers Software Development Engineer Yashvardhan Kukreja. That’s where synthetic monitoring comes in.

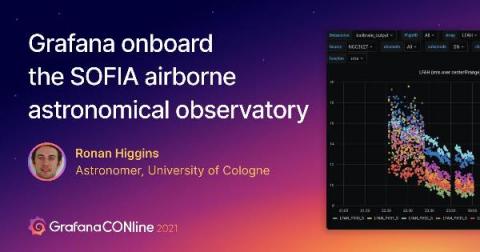
How astronomers use Grafana dashboards to read the stars (and their data) on the SOFIA airborne observatory

There’s stargazing, and then there’s SOFIA. The SOFIA airborne astronomical observatory is a joint NASA and German Aerospace Center endeavor consisting of a modified Boeing 747SP aircraft with a 2.7-meter reflecting telescope and a team of astronomers onboard.

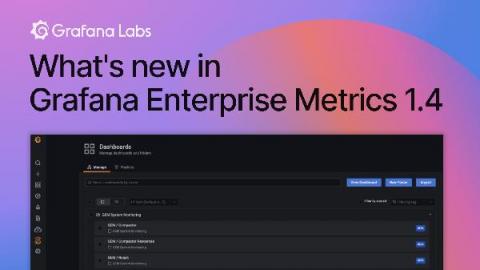
What's new in Grafana Enterprise Metrics 1.4: Cross-cluster query federation and self-monitoring

We introduced Grafana Enterprise Metrics (GEM) last September to give centralized observability teams the ability to provide a multi-tenanted, horizontally scalable Prometheus-as-a-Service experience for their end users. Since then, we’ve continued to make improvements and introduce new functionality. In this blog, I wanted to take a deeper dive into two of the exciting new features released with GEM 1.4.

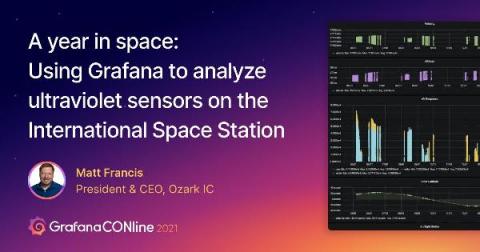
Monitoring UV sensors on the International Space Station with Grafana

In space, there’s no atmosphere to protect against the sun’s ultraviolet radiation. Astronauts in orbit are exposed to the equivalent of eight X-rays a day, and the space stations and suits that protect them degrade over time due to radiation and other factors. Scientists working on the International Space Station (ISS) want to know more about ultraviolet (UV) radiation in orbit so they can design better materials.