Operations | Monitoring | ITSM | DevOps | Cloud

Dashboards

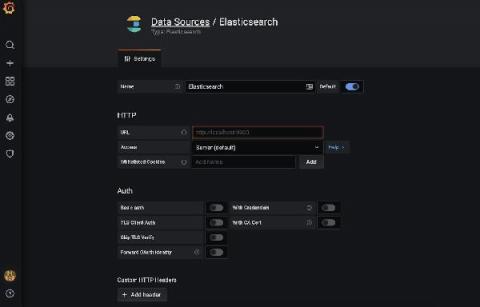
Why we're partnering with Elastic to build the Elasticsearch plugin for Grafana

As I’ve often talked about before, we have a “big tent” philosophy at Grafana Labs. We believe our users should determine their own observability strategy and choose their own tools; Grafana allows them to bring together and understand all their data, no matter where it lives. In practice, that means that we want to support data sources that our users are passionate about.

Elastic + Grafana Labs partner on the official Grafana Elasticsearch plugin

Today, I’m happy to share more about our partnership and commitment to our users that they will have the best possible experience of both Elasticsearch and Grafana, across the full breadth of Elasticsearch functionality, with dedicated engineering from both Grafana Labs and Elastic. Through joint development of the official Grafana Elasticsearch plugin users can combine the benefits of Grafana’s visualization platform with the full capabilities of Elasticsearch.

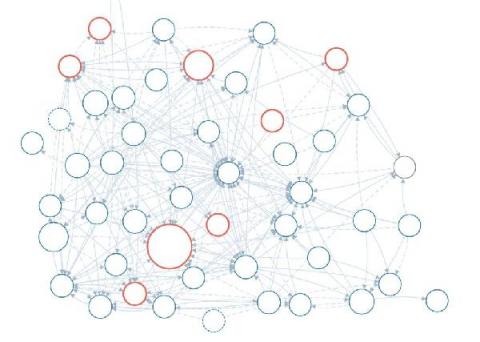
Service Map & Dashboards Provide Insight into Health and Dependencies of Microservice Architecture

With almost every blog you read about monitoring, troubleshooting, or more recently, the observability of modern application stacks, you’ve probably read a statement saying that complexity is growing as a demand for more elasticity increases which makes management of these applications increasingly difficult. This blog will be no exception, but there’s a good reason for that: we just enabled the first Sumo Logic customers with powerful new tools to tackle these exact challenges.

Correlate Your Metrics, Logs & Traces with the curated OSS observability stack from Grafana Labs

Correlation between metrics, logs, and traces should be as effortless as possible. This helps you make better decisions and actions. The Grafana Labs open-source observability stack enables powerful correlations between your metrics, log, and traces. The key here is to have consistent metadata across the three pillars of observability. Let me demo you how this works in this video.

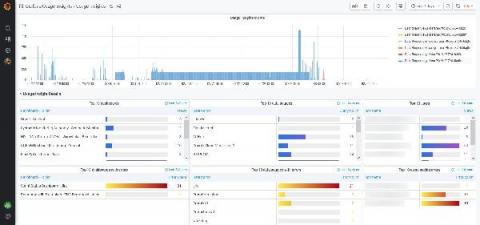
New in Grafana 7.4: Export usage data to Loki to help manage dashboard sprawl and troubleshoot faster

We first released the usage insights Enterprise feature in Grafana 7.0 based on feedback from customers that they would like to better understand how their users are interacting with Grafana, including the dashboards they visit, the information they query, and where they run into issues. What we learned was that dashboard sprawl is a real issue: Administrators estimate that almost 60% of dashboards might not be used at all.

Dashboard anything for free: SquaredUp Dashboard Server Public preview available now

How would your IT team be transformed if you could dashboard anything, for free? If you’re an IT pro and want an enterprise dashboarding tool that’s quick to implement, easy to set up, and effortless to maintain, you need SquaredUp Dashboard Server! The public preview of SquaredUp Dashboard Server just went live! Dashboard Server functions independently of SCOM and Azure and introduces a new PowerShell tile to take dashboarding a big step further. Now you can dashboard virtually any data.

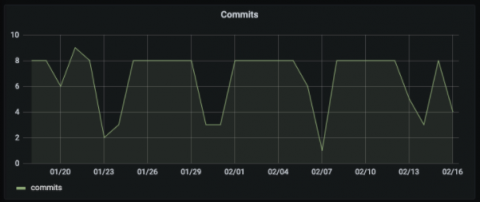
Troubleshoot problems using GitLab activity data with the new plugin for Grafana

GitLab is one of the most popular web-based DevOps life-cycle tools in the world, used by millions as a Git-repository manager and for issue tracking, continuous integration, and deployment purposes. Today, we’re pleased to announce the first beta release of the GitLab data source plugin, which is intended to help users find interesting insights from their GitLab activity data.

How to embed Grafana visualization in SquaredUp

In our previous post on Grafana and SquaredUp, we compared the two tools across various benchmarks like ease of deployment, time to value, dashboard creation, dashboard sharing, and more. Both tools have their specific advantages over the other, but since the ultimate goal is to give you a single place to look – why not leverage Grafana for the visualizations and data sources it offers, but give them meaning by embedding them in SquaredUp?