Operations | Monitoring | ITSM | DevOps | Cloud

%term

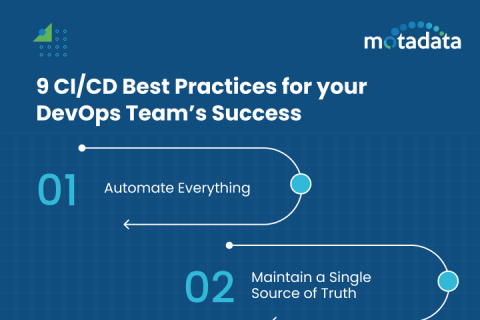
Top 9 CI/CD Best Practices for your DevOps Team's Success

Continuous Integration (CI) and Continuous Deployment (CD) have become quite popular in the software development environment for they emphasize automation and streamlined workflows. By implementing CI/CD best practices, developers will be able to deliver high-quality software faster and enhance productivity. However, the implementation of CI/CD practices is not an easy task, you may require careful planning to execute the process and gain results.

How to Derive Value from GenAI Application Development & Deployment Without Compromising on Security

The Generative Artificial Intelligence (GenAI) innovations and advancements over the past 1.5 years have been unmatched. Gartner predicts that by 2026, more than 80% of enterprises will have deployed GenAI-enabled applications in production environments and/or used GenAI application programming interfaces or models. This is up from less than 5% in 2023.

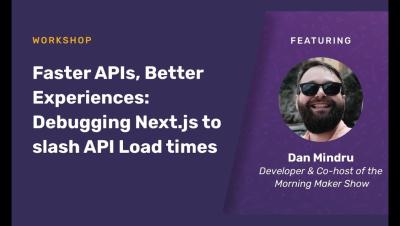
Faster APIs, Better Experiences: Debugging Next.js to slash API Load Times with Dan Mindru

From sluggish API calls to elusive bugs, debugging your Next.js application doesn’t have to mean hours of staring at logs and deciphering dashboards. Join Dan Mindru, co-host of the Morning Maker show, as he shows you how to debug errors and performance issues using Sentry’s Tracing and Session Replay. We’ll start by diving into API performance optimization, where you’ll learn to identify and fix bottlenecks efficiently. Next, see a live demo of how Dan uses tracing and session replay to capture and replay user sessions to fix issues across their stack.

[Workshop] Fix Your Front-End: JavaScript Edition

Hear from the team behind our JavaScript SDKs as they share practical tips to make debugging more tolerable. In this session we covered: Setting up and configuring Sentry for frontend projects How to trace frontend errors back to backend issues Analyzing web vitals to identify performance bottlenecks Using session replay for better user insights.

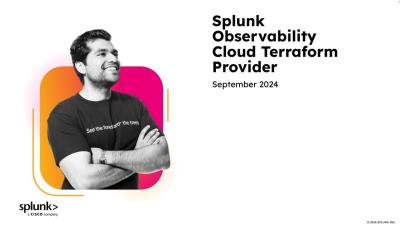
Introduction to The Splunk Terraform Provider | Create a Detector in Splunk Observability Cloud

In this video I will demonstrate how to use the Splunk Terraform Provider. I’ll explain what it is and why you should use the Splunk Terraform Provider as part of your overall Observability as Code solution. Using a simple Terraform project, I will walk you through the setup of the provider and the creation of a Detector in Splunk Observability Cloud.

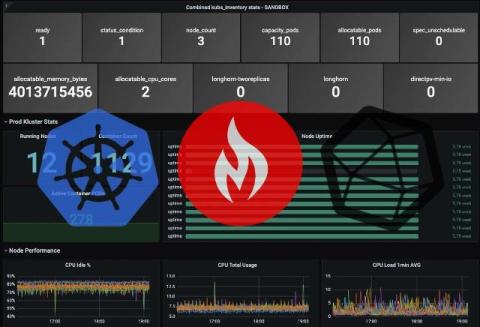
Guide to Adding K8 Inventory Stats to Your Telegraf Daemonset

Having insights into your Kubernetes environment is crucial for ensuring optimal resource allocation and preventing potential performance bottlenecks. It also enables proactive monitoring of application health and security, helping to quickly identify and resolve issues before they impact users.

The curious case of Marriott and the untold impact of web performance on revenue

In a world where attention spans are shorter than a TikTok, the last thing a company needs is a sluggish website. 53% of people will leave a mobile page if it takes longer than 3 seconds to load. Yet, despite this, many businesses—hotels included—are still sleeping on the importance of web performance. Marriott, one of the biggest names in hospitality, might just be learning this lesson the hard way. Could their lagging website be contributing to their recent stock stumble?

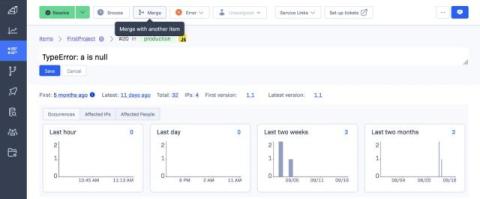
Reduce noise and save time with the new Merge feature on the item detail page

We are excited to release a new feature that will make it easier to group your items, reduce noise, and simplify your error management directly from the Item Detail page header. While you are investigating an item,, you can now search for other items within the same project and environment and merge right from that page without having to navigate back to the Item List page.