Operations | Monitoring | ITSM | DevOps | Cloud

%term

Creating Effective SLO Dashboards: A Comprehensive Guide

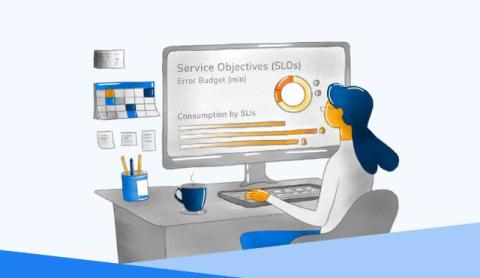
In modern software engineering, the concept of Service Level Objectives (SLOs) has become a cornerstone of reliable service delivery. SLOs define the acceptable level of service that a system must deliver, serving as a benchmark for both internal teams and external users. However, setting SLOs is only half the battle; effectively tracking and managing these objectives is crucial to ensure that services remain within the desired thresholds. This is where SLO dashboards come into play.

Networking Field Day 35: Democratization of Data Access Using Network LLMs with Selector AI

In this brief demo of the Selector platform, a user interacts with Selector Copilot to explore behavior within their network infrastructure. They first look into the latency of their transit routers, revealing a regional issue. The user drills down into network topology information to further investigate the latency, where they access details about devices, interfaces, sites, and circuits. Selector Copilot is then leveraged to surface circuit errors. Notably, each visualization provided by Selector Copilot can be copied and pasted onto a dedicated dashboard.

Networking Field Day 35: Selector AI Demo Part 2

In this demo, a user leverages Selector's Conversational AI, Selector Copilot, to investigate performance within their network infrastructure. The user first probes into the health of tenants located in a specific geographic region. Selector Copilot provides a visualization of the current state and summarization of the overall condition and afflicted tenants, along with probable root cause. The user then interacts with Selector Copilot to explore resource allocation, historical usage, and projected bandwidth. Each visualization provided by Selector Copilot can be copied and pasted onto a dedicated dashboard.

Networking Field Day 35: Selector AI Alerting Discussion with Nitin Kumar

Selector delivers consolidated, actionable alerts through your preferred collaboration platform, such as Slack or Teams. Alerts depend on Selector's powerful event correlation fueled by advanced AI/ML techniques. Automations can be leveraged to generate service tickets that include detailed summaries, root cause analysis, and even suggested remediations.

Tanzu Platform 10 Offers Cloud Foundry Users Deep Visibility and Productivity Enhancements

This year at VMware Explore Las Vegas, we're excited to announce VMware Tanzu Platform 10. This new release is tailored for modern enterprises, aiming to transform how organizations manage, secure, and optimize their applications with enhanced flexibility and observability. Tanzu Platform 10 allows you to choose between Cloud Foundry and Kubernetes for your platform runtime, whether in public or private cloud environments.

Cyber resilience: What it is & why it's important

In today’s age of high-profile data breaches, supply chain attacks, and aging legacy software, smart organizations understand it’s no longer a matter of whether their systems will be compromised but when it will happen next. In fact, one recent study found that 68% of organizations experienced a cyberattack within the last 12 months (experiencing an attack doesn’t necessarily mean it was successful).

Best Practices to Improve Project Management

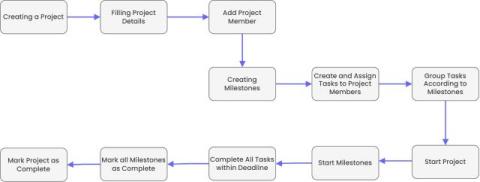
Project management is difficult work that requires a careful balance of strategy, operation, and control. The market for project management software is expanding, but adoption rates reveal another story that it is on a critical path. Almost 75% of businesses still use outdated project management methodologies during product development, such as spreadsheets or manual procedures, which hampers their capacity to complete projects successfully. Relying on obsolete tools presents a range of problems.

MSP Sales Models: Reselling and Selling FinOps services

Managed Service Providers (MSPs) are definitely in a competitive market. If you’re checking out Anodot, there’s a good chance you’re an MSP looking for a partner who can provide the right mix of tools and services to help you stand out to potential prospects. However, landing the client is only the start of the sales cycle. So, how can MSPs keep increasing profits while maintaining the quality that initially won them that business?

Latency vs. Jitter: Understanding Network Metrics

As you set out to optimize and understand your network, two essential metrics you'll need to master are latency and jitter. While they might seem similar at first glance, both latency and jitter represent distinct aspects of how data travels across a network, influencing everything from seamless VoIP calls and smooth video streaming to immersive online gaming and responsive cloud applications.

How to test and monitor your APIs with Playwright

You probably know that Microsoft’s Playwright is a solid tool for end-to-end testing, enabling you to control headless browsers and check essential user flows. But did you know that you can also use Playwright for API testing? If you didn’t, then this guide is for you. In this post, we’ll explore how Playwright can be used to test a GraphQL API (but don’t worry if you’re using REST; Playwright can handle any HTTP-based API).