Operations | Monitoring | ITSM | DevOps | Cloud

%term

Summer product updates

As we move into the fall season here at StatusGator HQ, we wanted to update you on our progress the last 2 months. In between vacations, our team has been hard at work bringing you the next iteration of StatusGator. We have a ton of new stuff you’ve probably already seen but the highlights are announced formally below. Stay tuned for a few more LONG requested features over the next few months!

How Machine Learning and AI are Transforming Telecom's Future

The telecommunications industry is no stranger to rapid technological advancements, but the integration of machine learning (ML) and generative AI is taking it to new heights. AI and ML are not just about technological transformation; they’re also revolutionizing people, processes, and the entire telco landscape. For tech enthusiasts and business leaders, understanding how these AI-driven innovations are shaping the future is crucial.

Burn rate is a better error rate

While building our Service Level Objectives (SLO) product, our team at Datadog often needs to consider how error budget and burn rate work in practice. Although error budgets and burn rates are discussed in foundational sources such as Google’s Site Reliability Workbook, for many these terms remain ambiguous. Is an error budget a static quantity or a varying percentage? Does burn rate indicate how fast I’m spending a fixed quantity, or is it just another way to express error rate?

More Value From Your Logs: Introducing Next Generation Log Management from Mezmo

Once upon a time, we thought “Log everything” was the way to go to ensure we have all the data we needed to identify, troubleshoot, and debug issues. But we soon had new problems: cost, noisiness, and time spent sifting through all that log data. Enter log analysis tools to help refine volumes of log data and differentiate signal from the noise to reduce mental toil to process. Log beast tamed, for now….

DevOps Incident Management: Streamline Your Processes for Resolution

In the world of DevOps, where development and operations blend seamlessly, incidents are bound to happen. But the way these incidents are managed can make all the difference. Imagine a high-stakes race where every second counts—this is what DevOps Incident Management feels like. It's not just about putting out fires; it's about learning from each one to prevent future flare-ups.

How Does Incident Management Automation Work? A Complete Guide

Managing incidents efficiently is crucial to maintaining service quality. But handling every issue manually can be time-consuming, prone to errors, and overwhelming for your team. That's where Incident Management automation comes into play, revolutionizing the way IT teams respond to and resolve issues. Automation within Incident Management takes the guesswork out of the process, enabling faster response times and improving overall service delivery.

Should You Get an Incident Management Certification? Top 4 Choices

In IT Service Management, the ability to manage incidents efficiently is crucial. Whether it’s a minor disruption or a major outage, having a skilled incident manager at the helm can make all the difference. But how do you become that go-to person in times of crisis? The answer lies in obtaining the right certifications. Incident Management certifications not only validate your skills but also equip you with the knowledge needed to handle any situation that comes your way.

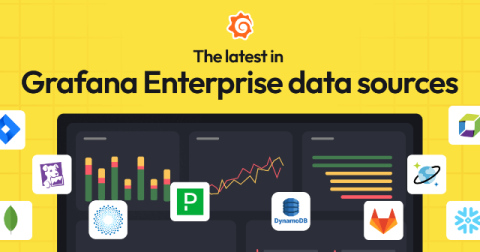
Visualize Catchpoint, PagerDuty, and Amazon DynamoDB data: what's new in Grafana Enterprise data source plugins

As part of our big tent philosophy here at Grafana Labs, we believe you should be able to access and derive meaningful insights from your data, regardless of where that data lives. One of the ways we stay true to that philosophy is through our Grafana Enterprise data sources.

Set up browser tests in Splunk Synthetic Monitoring using the Chrome DevTools Recorder

In this video I’ll introduce you to the Chrome DevTools Recorder and how you can use it with Splunk Observability Cloud’s Synthetic Monitoring feature. I’ll explain what the Recorder is and then demonstrate how you can create a recording. We’ll then export the recording and upload it as a new browser test in Splunk’s Synthetic Monitoring feature. After uploading, I’ll walk through the test results and explain when it makes sense to use the Recorder for your Synthetic Monitoring tests.

How Data Observability is Transforming Modern Enterprise

Modern enterprises are more dependent than ever on data. That's why it's more important than ever for organizations to ensure that their data is accurate, reliable, and easily accessible. Data observability is a modern method that helps achieve this. It involves real-time monitoring of data to detect unusual patterns. By doing so, it ensures data quality and reliability, which boosts operational efficiency and governance.