Operations | Monitoring | ITSM | DevOps | Cloud

%term

Understanding IoT Logging Formats in Azure and AWS

Internet of Things (IoT) devices are everywhere you look. From the smartwatch on your wrist to the security cameras protecting your offices, connected IoT devices transmit all kinds of data. However, these compact devices are different from the other technologies your organization uses. Unlike traditional devices, IoT devices lack a standardized set of security capabilities, making them easier for attackers to exploit.

DevOps Security Best Practices: 2025 Guide

Is your DevOps security ready for cyber threats? Embrace these best practices and make security your competitive advantage. DevOps, a set of practices that combines software development (Dev) and IT operations (Ops), has revolutionized the way organizations build, deploy, and maintain software. With the rise of cloud computing, there was a need for faster and more reliable software delivery than traditional software development methodologies allowed. DevOps was the natural evolution.

Creating alerts from panels in Kubernetes Monitoring: an overlooked, powerhouse feature

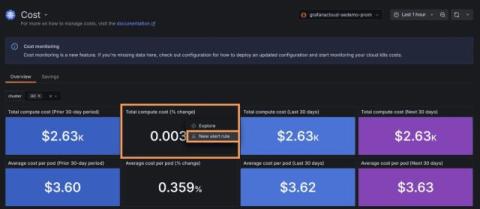
As a product manager here at Grafana Labs, I’ve learned that sometimes the most powerful features can sneak by unnoticed, buried in those three little dots off to the side of the panel. But what happens when one of those hidden gems suddenly becomes the star of the show? Recently, we released a new Kubernetes Monitoring feature in Grafana Cloud—an alert system you can use to create alerts from panels in the app.

Observability as a superpower

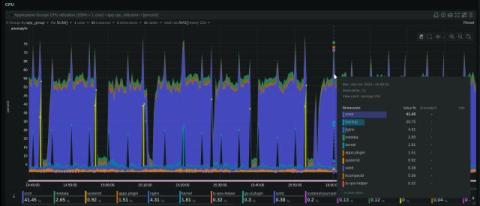
With every job I have, I come across a new observability tool that I can’t live without. It’s also something that’s a superpower for us at incident.io: we often detect bugs faster than our customers can report them to us. A couple of jobs ago, that was Prometheus. In my previous job, it was the fact that we retained all of our logs for 30 days, and had them available to search using the Elastic stack (back then, the ELK stack: Elasticsearch, Logstash, and Kibana).

Cribl Copilot Leverages Our Docs to Get You Answers Faster Than Ever Before!

Cribl employees are renowned for their insatiable curiosity, especially when it comes to their passions. Having been a technical writer for most of my adult life, this goat is deeply passionate about two things: writing engaging content and understanding the mindset of our users. As one of our founders always says, “Software is a people business.” To make my users successful, I need to know how they think. But what if the “user” is a machine? This goat is intrigued.

Unlocking the Power of UIMAPI: Automating Probe Configuration

The UIMAPI is a RESTful API. With UIMAPI you can programmatically perform almost any action in your DX UIM environment. Using the Swagger front-end as a guide, you can manually execute REST endpoints. However, many customers would rather use a program to automate these actions.

Against Incident Severities and in Favor of Incident Types

About a year ago, Honeycomb kicked off an internal experiment to structure how we do incident response. We looked at the usual severity-based approach (usually using a SEV scale), but decided to adopt an approach based on types, aiming to better play the role of quick definitions for multiple departments put together. This post is a short report on our experience doing it.

How Implementing Load Balancing Optimizes Service Performance

Considering implementing load balancing? Slow websites and website downtime are more than just nuisances. One study found that slow-loading websites cost online retailers more than $77 billion each year in lost sales. Over half of consumers cite a slow webpage as the main reason for abandoning an online purchase, and just under half will not return to a website after a bad experience.

Track and troubleshoot MongoDB performance with Datadog Database Monitoring

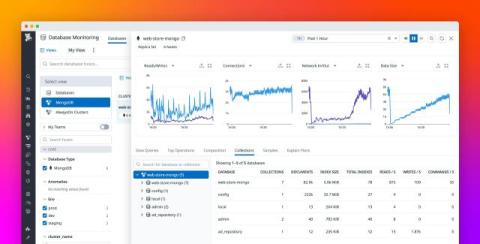
Many modern applications rely on MongoDB and MongoDB Atlas to manage growing data volumes and to provide flexible schema and data structures. As organizations adopt these and other NoSQL databases, effective monitoring and optimization become critical, especially in distributed environments.