Operations | Monitoring | ITSM | DevOps | Cloud

Blog

How SevOne Is Live Streaming Grafana Data Sources

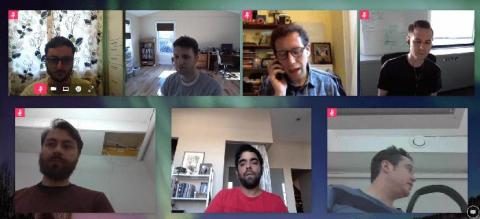
SevOne, a 14-year-old company in the network monitoring space, started using Grafana for self-monitoring last year because there weren’t many frontend engineers in the organization at the time. “We fell in love with it,” SevOne Tech Lead Sean Lafferty said during his GrafanaCon talk about how the company live streams Grafana data sources.

Why we love customer reviews at Mattermost

If you’re like most people, you consult customer reviews before choosing whether to buy something online. Reviews help us make better decisions since they provide insight into how real-world customers experience a company’s products or services. Instead of being told what a company wants you to hear, you get to hear what’s what directly from actual users. We love customer reviews at Mattermost.

Introducing the Sentry Integration Platform

Since Sentry started, people have been asking us to build integrations for their favorite services. We get it — developer tools are always better when they work together. As Socrates said, teamwork makes the dream work. We like to help out, and that’s why today we’re launching the Sentry Integration Platform. Now you have the power to build the kind of integrations you want to see in Sentry. No need to wait around for us to do it.

Next Time You Configure or Update Your Network Interfaces Use This Checklist

Interfaces, commonly known as ports, are a vital component of any network. Need to connect two pieces of equipment? It could be as easy as plugging in cables—but then you’re using out of the box configurations that don’t follow best practices and are inherently insecure.

Zenoss Recognized as a Leader in Forrester Wave: IASM

Several months ago, the team here at Zenoss made some key predictions about infrastructure and service monitoring for 2019. Among them was this observation: A strategy relying on multiple disparate solutions to track the performance of the various aspects of an application’s performance no longer has legs, much as groups of infrastructure point tools are not effective at providing complete visibility across data center infrastructure.

Monitor Twistlock with Datadog

Twistlock is a platform for managing security and compliance within various environments, including virtual machines, containers, and serverless functions. Ensuring legal and technical security is just as valuable as preventing outages and errors, which is why Datadog is delighted to announce a new integration with Twistlock. With this integration, you can track security and compliance risks within the same platform as the metrics, traces, and logs you already collect with Datadog.

How to use Stackdriver monitoring export for long-term metric analysis

Our Stackdriver Monitoring tool works on Google Cloud Platform (GCP), Amazon Web Services (AWS) and even on-prem apps and services with partner tools like Blue Medora’s BindPlane. Monitoring keeps metrics for six weeks, because the operational value in monitoring metrics is often most important within a recent time window. For example, knowing the 99th percentile latency for your app may be useful for your DevOps team in the short term as they monitor applications on a day-to-day basis.

Using React Select with Redux Form

At FireHydrant we use Redux Form for all of our forms. It is extremely easy to build complex form logic with all sorts of added bonuses that make using it in our React/Redux front end a no brainer. However, when we started using React Select for our select fields we started running into some issues. You are likely running into some of the same issues we did and so this blog post will help get you off the ground and integrating these two libraries together.