Operations | Monitoring | ITSM | DevOps | Cloud

Blog

Best Practices for Proactive Monitoring

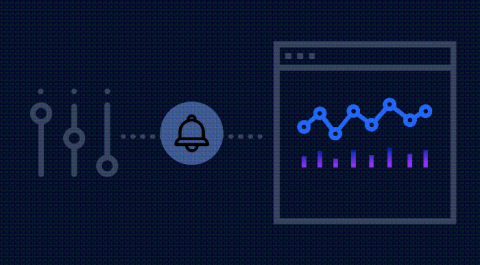
If you could know information about your systems in advance, what would you choose to know? If there was a set of repeating behaviors that happened consistently before an outage, would you want to know what they were? This is the idea behind proactive monitoring – the switching of context from “reactive” monitoring to something that allows you to act before the problem arises. Here are some guidelines to help you get started with your customized solution.

Atlassian acquires AgileCraft to scale agile to the enterprise

We’ve heard from our enterprise customers that these problems are really hard to tackle – and they need our help along the way. That’s why we’re excited to share we’ve entered into an agreement to acquire AgileCraft, a leader in enabling scaled agile transformations. Many Atlassian customers, including AT&T, Anthem, NCR, TIAA, and Duke Energy trust AgileCraft to scale their teams’ agile practices.

Should you build or buy a crash reporter?

You’re in the process of creating and launching new softwareand you want it to be as stable as possible. Or, maybe your software has been running for a while, but you’re frustrated with the bug-reporting workflow in place. Either way it’s time to look for a crash reporting process that fits your application. This leads to a natural question: Should we build it? Or should we buy it?

Mono-Repo vs One-Per-Service

With AWS Lambda, we can deploy and scale individual functions. However, we as engineers still like to think in terms of services and maintain a mapping between business capabilities and service boundaries. The service level abstraction makes it easier for us to reason about large systems. As such, cohesive functions that work together to serve a business feature are grouped together and deployed as a unit (i.e. a service) through CloudFormation.

Office 365 Outage Report & End User Monitoring

Experts Live is one of the largest community conferences with a focus on a broad range of Microsoft technologies including Azure, Office 365, Intune, System Center, Automation, Virtualization (Azure Stack, Docker), and Enterprise Mobility + Security, just to name a few. Top experts from around the world present discussion panels, ask-the-experts sessions and breakout sessions, and cover the latest products, technologies and solutions.

Monitor IBM MQ metrics and logs with Datadog

IBM MQ is enterprise-grade message-oriented middleware (MOM). Previously known as MQSeries and renamed to WebSphere MQ, IBM MQ is known for its stability and reliability. Companies in industries ranging from financial services to retail to aviation use it as an integral part of their backend infrastructure. Datadog’s new IBM MQ integration enables users to collect key metrics and logs from their IBM MQ instances and visualize them with a customizable out-of-the-box dashboard.

Java Garbage Collection Logging with the ELK Stack and Logz.io

Java programs running on JVM create objects on the heap. At some stage, these objects are no longer used and can pile up as “garbage” needlessly taking up memory. Replacing the manual process of explicitly allocating and freeing memory, the Java Garbage Collection process was designed to take care of this problem automatically.