Operations | Monitoring | ITSM | DevOps | Cloud

Blog

AWS Elastic Beanstalk .NET Core Getting Started

AWS offers a variety of services to solve specific needs. There are some core services, like EC2 and VPC, that let you create an infrastructure for your applications that scales easily. But if you’re new to AWS and also new to infrastructure, you might need to invest some time reading before you deploy your application to AWS. I remember my first time using AWS; the sysadmin explained to me what systems we were using in AWS to run the company’s main application.

The Most Expensive Website Downtime Periods in History

An extended period of website downtime is the stuff of nightmares for companies large and small. For a company such as Amazon, even one single minute of downtime can cost as much as $220,318.80 according to the latest calculations. For smaller companies, that figure will be minuscule in comparison, but it’s a number which can quickly snowball the longer your website is offline.

Website Management Tips for Business Owners

Whatever the nature of your business, whether you are a freelancer or an online retailer, the quality of your website is key to the success of your organisation. A well-run website serves as the online storefront of your organisation, acting as the destination point for people who are searching for the services you provide or the products you sell. Are you confident that you have all the main bases covered when it comes to the management of your website?

Monitor Amazon Managed Streaming for Apache Kafka with Datadog

Amazon Managed Streaming for Apache Kafka (MSK) is a fully managed service that allows developers to build highly available and scalable applications on Kafka. In addition to enabling developers to migrate their existing Kafka applications to AWS, Amazon MSK handles the provisioning and maintenance of Kafka and ZooKeeper nodes and automatically replicates data across multiple availability zones for high availability.

Solr-diagnostics: How to use it and what it collects

If you’re running Solr and have to troubleshoot it (or maybe you just want a good overview!), then you’d probably want to collect logs, configs, maybe a snapshot of metrics and some system data, like top or netstat. We created a small tool for this exact task, creatively named solr-diagnostics. It’s been out there for almost two years, and we found it useful in our Solr consulting and production support engagements. So we thought it’s about time to spread the word.

Docker Container Performance Metrics to Monitor

In Part 1 we’ve described what container monitoring is and why you need it. Because each container typically runs a single process, has its own environment, utilizes virtual networks, or has various methods of managing storage. Traditional monitoring solutions take metrics from each server and the applications they run. These servers and applications running on them are typically very static, with very long uptimes.

Docker Containers Management: Main Challenges & How to Overcome Them

Even though containers have been around for ages, it wasn’t until Docker showed up that containers really became widely adopted. Docker has made it easier, faster, and cheaper to deploy containerized applications. However, organizations that adopt container orchestration tools for application deployment face new maintenance challenges.

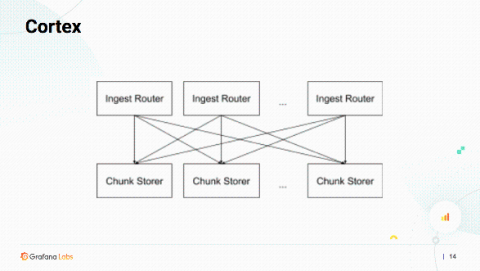
How Cortex Is Evolving to Ingest 1 Trillion Samples a Day

As the open-source monitoring system Prometheus grew, so did the need to grow its capacity in a way that is multi-tenant and horizontally-scalable, along with the ability to handle infinite amounts of long-term storage. So in 2016, Julius Volz and Tom Wilkie (who is now at Grafana Labs) started Project Frankenstein, which was eventually renamed Cortex.

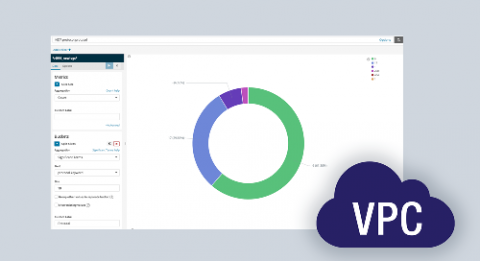
13 Security Alerts and Visualizations for VPC Flow Logs

AWS VPC Flow Logs record details about the traffic passing through your application, including requests that were allowed or denied according to your ACL (access control list) rules. It also has information about the IP addresses, and ports for each request, the number of packets, bytes sent, and timestamps for each request. This information brings deep visibility and the ability to improve your security posture over time.

Mattermost 5.19: Webex plugin, faster development cycles with GitLab, 1-click Mattermost install on DigitalOcean, and more

Mattermost 5.19 includes new features that will help your team work together more efficiently. Try these new features by downloading Mattermost 5.19 today. Since it includes security updates, upgrading is recommended.