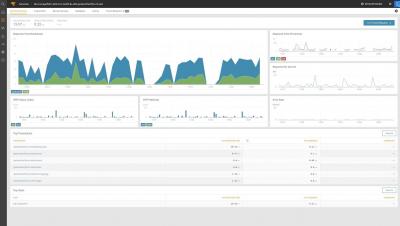
Citrix deployments – needless to say but let me say it nevertheless – are complicated. There are too many moving parts, various dependencies, and myriad configurations and customizations. Ultimately, organizations expect seamless connectivity and access to virtualized applications and desktops for their employees and partners whenever and wherever.
It’s rare to find a business today that doesn’t rely on digital technologies and services. Retail is one example: Whether customers are buying online or in store, completing a transaction requires a website or point-of-sale system. The entire supply chain relies on IT services to deliver goods on time, to the right locations, and just like any company today, every department —from development and marketing, to HR and business services—has a critical tech stack.
The term Data Center Monitoring is used in the communications plan of some companies as if it were a product specially designed for this area. However, when it comes to these ideas we believe that they actually refer to a summary of monitoring tools facilities that are intended to support the work of Data Centre managers.
You’ve just recovered from a critical application outage and your team is being asked to report on root cause and recommended remediation steps later this afternoon. Can you quickly analyze all the data, identify all the leading events, and discern which one was responsible for the cascading failure?
We are very excited to announce a new capability for our Amazon S3 sources. Until recently, the only method Sumo Logic used for discovering new data in an S3 bucket was periodic polling. However, with our new notification-based approach, users can now configure S3 sources such that Sumo Logic is notified immediately (via AWS SNS) whenever a new item is added to an S3 bucket, eliminating the need to wait for new objects to be discovered via periodic polling.
We’re excited to announce the general availability of our new On-Prem, Self-Hosted, and Multi-Cloud logging platforms. Our customers will have the capability to log data in their infrastructure of choice. Whether across multiple public/private clouds or within a customer’s own data center, logs can be viewed through a unified interface while addressing any data locality and performance requirements.
By now you’ve learned about reducing the sheer amount of alerts you’re getting as well as automated triage and remediation. In this post, I’ll go into some extra steps you can take to further fine tune Sensu and cut down on alert fatigue.
Our new RubyGems.org public dataset is now available — use it to analyze global download traffic of all gems hosted on RubyGems!
After some hard worked weeks we are able to give you Statuspal 2.0! This release features some big changes especially on the themes side. We have re-engineered from the ground up how we render your status page so you can write fully customized themes that look exactly how you want, and modify the existing ones too.