Operations | Monitoring | ITSM | DevOps | Cloud

%term

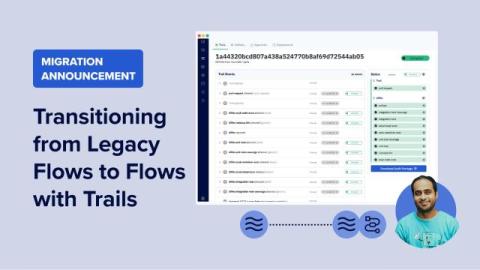
Migration Announcement: Transitioning from Legacy Flows to Flows with Trails

We are excited to announce that we will be migrating your Kosli Flows data to Flows with Trails. This transition will unlock access to our latest features, such as the first-class Sonar integration, as well as upcoming ones like environment compliance policies and custom attestation types. Legacy Flows have served us well in the early stages, where they were designed to map the value stream of producing a single software artifact.

DevOps Best Practices to Transform Your Development Process

Businesses are under constant pressure to deliver software faster and more reliably. Yet, the real challenge lies in maintaining quality standards without sacrificing speed. Traditional software development methods often lead to silos between teams, slower release cycles, and more frequent errors. These inefficiencies impact the speed of software delivery, risk system downtime, and customer satisfaction. The solution? Implementing DevOps best practices.

Kafka Security Auditing: Tools and Techniques

Let’s face it—when it comes to security in Kafka, you can’t afford to mess around. With more and more sensitive data streaming through Kafka environments, it’s no surprise that Kafka security auditing has become a crucial part of ensuring both compliance and overall security. But if you’re new to this or feel like your current process needs a tune-up, don’t worry—we’ve got your back.

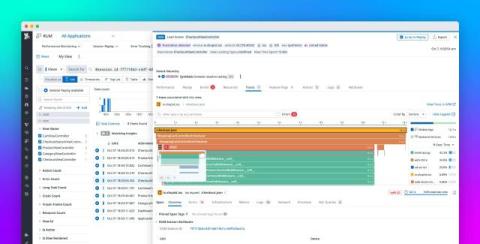
Trace your applications end to end with Datadog and OpenTelemetry

As teams adopt OpenTelemetry (OTel) to instrument their systems in a vendor-neutral way, they often face a challenge in effectively tracing activity throughout their entire stack, from frontend user interactions to backend services and databases. While OTel enables basic tracing, teams still need a way to access advanced capabilities like continuous profiling to adequately optimize performance and troubleshoot issues in their applications.

Datadog named a Leader in first ever 2024 Gartner Magic Quadrant for Digital Experience Monitoring

We are thrilled to announce that Datadog has been named a Leader in the first ever 2024 Gartner Magic Quadrant for Digital Experience Monitoring. Datadog was positioned the highest in its Ability to Execute. We believe this placement reflects our commitment to being an end-to-end observability platform that brings together all signals from across your tech stack into a unified ecosystem.

Understanding Jaeger - From Basics to Advanced Distributed Tracing

Jaeger has emerged as a crucial tool in the modern distributed systems landscape, offering powerful tracing capabilities that help organizations understand and optimize their microservices architectures. This comprehensive guide explores everything from basic concepts to advanced implementations, providing you with the knowledge needed to effectively implement and utilize Jaeger in your environment.

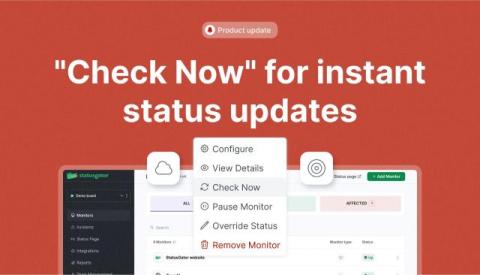
"Check Now" for instant status updates

We’ve just rolled out a new Check Now feature for Website and Ping monitors! This lets you manually check the current status of your monitor instantly, right from the admin board. Whether you’re monitoring a Website or using a Ping monitor, this option provides the most up-to-date status when you need it. To access the Check Now feature, simply go to your Monitors page, find the Website or Ping monitor you’d like to check, and click the three dots icon next to it.

Optimizing Kubernetes workloads with AI-powered monitoring

Kubernetes has drastically simplified application deployment. However, managing workloads in Kubernetes is a challenge because of their innate complexity and dynamism. Frequent bottlenecks and unpredictable application behavior can make managing Kubernetes workloads much harder. This has become simpler and lighter after the expansion of AI, which provides a more intelligent approach to managing and optimizing Kubernetes environments.