Operations | Monitoring | ITSM | DevOps | Cloud

%term

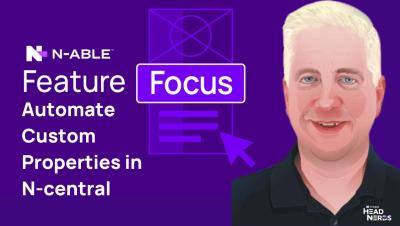
Advanced Device Management: Automate Custom Properties in N-central

Discover how to enhance your device management with N-central by creating custom properties to store critical information like public IP addresses and BitLocker Recovery Keys. In this video, Paul Kelly from the N-able Head Nerd Team guides Managed Service Providers (MSPs) through setting up scheduled tasks that automatically gather and store additional device data.

Ribbon Voice Network Transformation - The Savings Pay for the Conversion

Ribbon's Fixed Network Transformation solutions consolidate and modernize infrastructure, eliminating inefficiencies. Ribbon provides solutions to transform both the core IP and optical networks and the IP-based communications services that run on top of that network, helping service providers expand and improve business services as well as enter new markets like unified 5G xhaul and broadband backhaul. At the same time, these transformations reduce the cost and complexity of delivering traditional residential communications services by dramatically reducing recurring power, HVAC, space, and staffing costs.

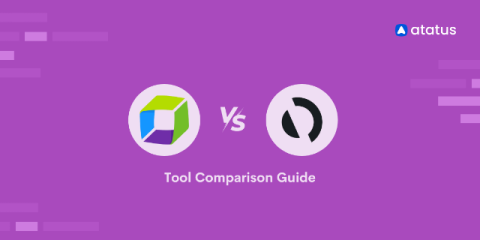
Dynatrace vs AppDynamics - A Feature Comparison Guide

Dynatrace and AppDynamics are two of the most well-known Observability and monitoring tools. Even though they share many features, they have several differences that might make you choose one over the other. Dynatrace is great for comprehensive system performance monitoring. It covers everything from infrastructure and application performance to log management and real user monitoring. AppDynamics, on the other hand, focuses more on application performance and business transactions.

WWDC 2024: What IT Admins Need to Know About Apple's Announcements

Apple's announcements at this year’s Worldwide Developers Conference have surprised everyone with new capabilities designed to make the IT admin's life easier for managing and securing devices. As we expected, Apple kept expanding declarative management configurations and capabilities for securing iPhones and iPads and robust management of macOS in the enterprise.

The rise of AIOps in infrastructure monitoring

Drowning in data from complex environments? Ditch the reactive approach. Artificial intelligence for IT operations (AIOps) empowers proactive management with comprehensive observability. According to Gartner, IT spending will continue to mount sky-high despite the global economic instability; the IT expenditure is predicted to surge by 8.6% in 2024. Manual monitoring often fails to keep up with the complexity of modern IT environments, leaving critical issues undetected.

Grafana Alloy 1.3 release: Debug pipelines in real time

Grafana Alloy 1.3 is here! First introduced earlier this year, Alloy is our open source distribution of the OpenTelemetry Collector. It has native pipelines for OpenTelemetry and Prometheus telemetry formats, and it uses the same components, code, and concepts that were previously introduced in Grafana Agent Flow. This new release introduces live debugging, enhancing debugging capabilities across key components, which are the building blocks of Alloy.

Network Performance Dashboard

In this dashboard tutorial video, we will walk you through building a Network Performance dashboard. This dashboard provides users with the visibility they need into the status of their network performance from their offices down to an individual users device. Obtaining this single pane of glass visibility is made easy with the combination of both CloudReady and Service Watch metrics into dashboards. When utilizing these dashboards, users can quickly identify which networks are performing poorly, allowing them to quickly resolve issues and ensure end users have an optimal experience.

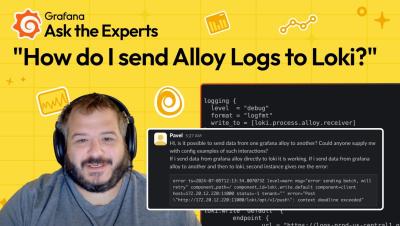
How to Send Grafana Alloy Logs to Grafana Loki | Ask the Experts | Grafana

In this video, Matt Durham, Sr. Software Engineer on the Grafana Alloy team, shows you how to send Grafana Alloy logs to Loki. Specifically, we address the question: "Is it possible to send data from one Grafana Alloy to another? Could anyone supply me with config examples of such interactions? If I send data from Grafana Alloy directly to Loki, it is working. If I send data from Grafana Alloy to another, and then to Loki, the second instance gives me an error.".

Purpose and Goals of Daily Stand-up Meetings

Stand-up meetings are a cornerstone for any engineering team. When done right, they can make a huge difference in keeping everyone on the same page, fostering collaboration, and building a strong team culture. However, getting them right can be a bit tricky. Drawing from our own experience of running engineering stand-ups at Zenduty, and insights from some of the best engineering managers in my network, I'd love to share some tips and insights on how to make your stand-ups effective.