Operations | Monitoring | ITSM | DevOps | Cloud

%term

Let's go dark!

There was time, where CRT screens were ubiquitous. In this time dark websites were pretty common since the way CRT screen emits light worked pretty well with dark colours. Then LCD screens came into every hour. Those were pretty bad compared to CRT, especially in terms of showing true shades of grey. This was the end of black websites popularity. Dark went underground.

Java runtime monitoring with JVM metrics in Datadog APM

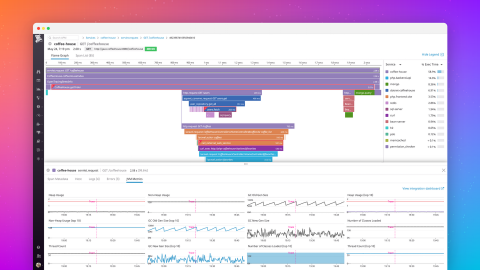
Whether you’re investigating memory leaks or debugging errors, Java Virtual Machine (JVM) runtime metrics provide detailed context for troubleshooting application performance issues. For example, if you see a spike in application latency, correlating request traces with Java runtime metrics can help you determine if the bottleneck is the JVM (e.g., inefficient garbage collection) or a code-level issue.

The Top 5 Pitfalls of Serverless Computing and How to Overcome Them

Serverless first came onto the scene in 2014 when AWS Lambda was launched. It offers a dynamic cloud-computing execution model where the server is run by the cloud provider. As with any relatively recent technology, its novelty results in a steep learning curve, and it comes with its own set of benefits and drawbacks.

Abstracting Credentials from Python Scripts

Python has rapidly grown into one of the most popular languages for automation. That’s why LogicMonitor supports Python when it comes to managing your LM portal and expanding your monitoring coverage with scripts. During your scripting adventures, you may find yourself wanting to take your work to the next level. One widely-applicable improvement is credential abstraction.

Manual Rotation of Certificates in Rancher Kubernetes Clusters

Kubernetes clusters use multiple certificates to provide both encryption of traffic to the Kubernetes components as well as authentication of these requests. These certificates are auto-generated for clusters launched by Rancher and also clusters launched by the Rancher Kubernetes Engine (RKE) CLI.

Helping IT admins tackle commonly encountered web application issues

Unless there’s been a huge breakthrough in technology that proves beneficial to employees, or something goes wrong that affects the business’ typical work processes, IT teams’ efforts often go unnoticed. Since significant breakthroughs are few and far between, more often than not, when someone’s contacting IT, it’s with a problem.

Logs monitoring

Logs Monitoring plays an important role in analyzing, troubleshooting and alerting on problems. Organizations have lots of data in logs that should be mined to get valuable insights on users, applications and systems behavior. Real time alerting from logs monitoring does help in identifying the problems early. It also provides security related insights when someone is trying to break into your organization.

Synthetic Monitoring vs. Real User Monitoring for Application Performance Management: Pros and Cons

It is no longer sufficient for IT operations teams to monitor resources like CPU, memory and disk utilization. The success of any IT initiative these days is measured based on user experience. Irrespective of the type of application in question – whether email, Citrix/VDI, SAP, web application – application availability and response time are key measures of user experience. Application outages not only affect users, they can also impact the business.