Operations | Monitoring | ITSM | DevOps | Cloud
%term
Man-in-the-middle attacks on the rise. Monitor your DNS
For our tech-minded readers, we strongly recommend you read the suggested articles in the US-CERT notification for detailed examples of how the hijacking takes place, for the rest of you, we’ve put together a summary of how the multifaceted attacks work.
Creating a Project Post Mortem | The Why's and How's of Finishing Projects
A project post mortem is a lethal-sounding term that seeks to answer the question: did this project work? Was it worth the investment and the time, and if it wasn’t can you learn from it? As the term implies, the project must be “no more” or “ceased to be” or “bereft of life.” Creating this document requires a time investment, and it’s tempting to just move onto the next project.
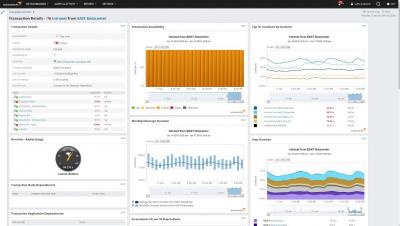
Web Performance Monitor - Monitoring the End-User Experience
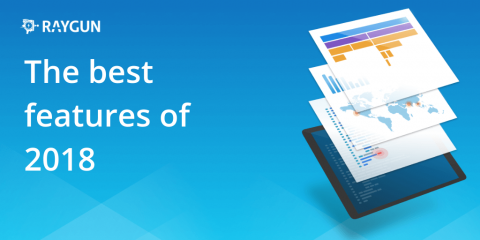
Raygun's favorite features of 2018
In 2018, we launched many improvements to the Raygun Platform, including the biggest ever addition to Raygun: Application Performance Monitoring (APM). For this article, we wanted to surface our favorite releases from 2018, just in case you missed them.
Automate Resource Adjustments for Amazon EC2 with Opsgenie Actions, A Use Case
Opsgenie Actions enable you to automate manual, repetitive tasks so that your resources are freed up to concentrate on higher-value work. This blog post is the second in a series of use cases in which we discuss how Opsgenie works with various third-party automation platforms to automate these traditionally manual tasks—right from the Opsgenie console or mobile app— to reduce interruptions for your on-call responders, and ultimately help your bottom line.
Kafka Logging with the ELK Stack
Kafka and the ELK Stack — usually these two are part of the same architectural solution, Kafka acting as a buffer in front of Logstash to ensure resiliency. This article explores a different combination — using the ELK Stack to collect and analyze Kafka logs. As explained in a previous post, Kafka plays a key role in our architecture. As such, we’ve constructed a monitoring system to ensure data is flowing through the pipelines as expected.
The Sentry Workflow - Triage
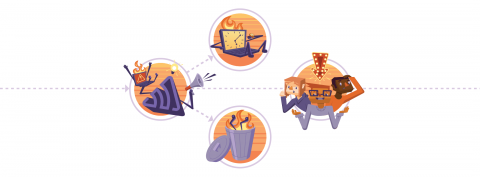
We get it — errors suck. And you don’t want to spend too much of your time fixing them, dealing with them, investigating them, etc. In our Workflow blog post series, we’ll help you optimize your, well, workflow, from crash to resolution. To quote “the second-most frequently quoted writer in The Oxford Dictionary of Quotations after Shakespeare,” Alexander Pope, “to err is human.” There will always be errors, even in code written by the best developers.
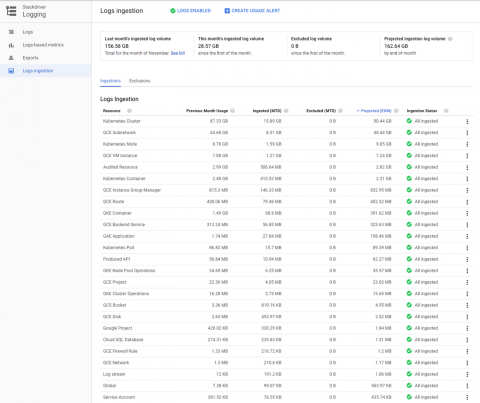
Stackdriver usage and costs: a guide to understand and optimize spending
Google Stackdriver is a cloud-based managed services platform designed to give you visibility into app and infrastructure services. Stackdriver’s monitoring, logging and APM tools make it easy to navigate between data sources to view performance details and find the root causes of any issues.


