Operations | Monitoring | ITSM | DevOps | Cloud
Tracing
The latest News and Information on Distributed Tracing and related technologies.
Use Logz.io to Instrument Kubernetes with OpenTelemetry & Helm
Logz.io is always looking to improve the user experience when it comes to Kubernetes and monitoring your K8s architecture. We’ve taken another step with that, adding OpenTelemetry instrumentation with Helm charts. We have made Helm charts available before, previously with editions suitable for Metricbeat and for Prometheus operators.
Is Distributed Tracing Really a Big Deal ?
What Is the OpenTelemetry Project and Why Is It Important?
The OpenTelemetry project is an ambitious endeavor with of goal of bringing together various technologies to form a vendor neutral observability platform. Within the past year, many of the biggest names in tech provide native support within their commercial projects.
Distributed Tracing vs. Application Monitoring
2 Ways to Integrate the Jaeger App with VMware Tanzu Observability Without Code Changes
In microservices architecture, to identify performance issues—including latency—it’s important to monitor each service and all inter-service communication. Jaeger and VMware Tanzu Observability can help. Jaeger is an open source, distributed tracing system released by Uber Technologies. VMware Tanzu Observability is a high-performance streaming analytics platform that supports 3D observability (e.g., metrics, histograms, and traces/spans).
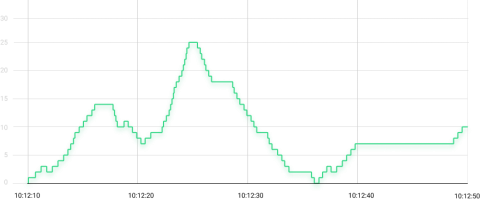
Monitoring Queues and Resources with Kamon Range Samplers
In this article we discuss the origin story of Kamon’s Range Samplers: what they are, how they work, and how we use them to monitor queues, connection pools and more.
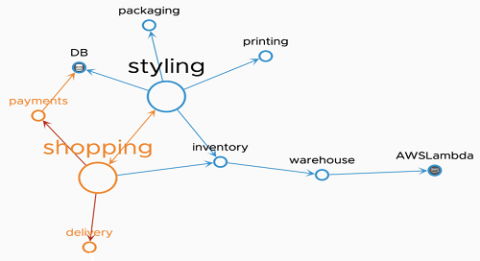
Using Distributed Tracing in Microservices Architecture
From Distributed Tracing to APM: Taking OpenTelemetry & Jaeger Up a Level
It’s no secret that Jaeger and OpenTelemetry are known and loved by the open source community — and for good reason. As part of the Cloud Native Computing Foundation (CNCF), they offer one the most popular open source distributed tracing solutions out there as well as standardization for all telemetry data types.
Adding free and open Elastic APM as part of your Elastic Observability deployment
In a recent post we showed you how to get started with the free and open tier of Elastic Observability. Today we'll walk through what you need to do to expand your deployment so you can start gathering metrics from application performance monitoring (APM), or "tracing" data in your observability cluster, for free.


