Operations | Monitoring | ITSM | DevOps | Cloud
Tracing
The latest News and Information on Distributed Tracing and related technologies.
Instrumenting Java Applications for Tracing with OpenTelemetry and Jaeger
The aim of this article is to demonstrate how you can instrument a Java application using Opentelementry and Jaeger. In this example, we will be instrumenting our Java application using OpenTelemetry and the OpenTelemetry Java client, and the tracing data will be exported and visualized using Jaeger. We will use the Logz.io Jaeger backend as it is compatible with common tracing standards like Zipkin, OpenTelemetry, and OpenTracing.
Real-time distributed tracing for Go and Java Lambda Functions
Serverless applications streamline development by allowing you to focus on writing and deploying code rather than managing and provisioning infrastructure. To help you monitor the performance of your serverless applications, last year we released distributed tracing for AWS Lambda to provide comprehensive visibility across your serverless applications.
Instrumenting Microservices with Istio for Distributed Tracing
Previously, I wrote a Beginner’s Guide to Jaeger + OpenTracing Instrumentation for Go providing guidance on manually instrumenting Go services. This is useful for cases where we want fine-grained tracing of specific functions. However, what if all we want is to trace a service’s inbound and outbound calls with little to no additional code?
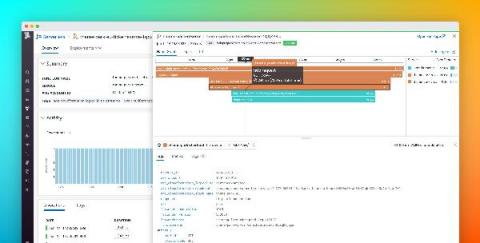
Find the Root Cause Faster with Trace View and Trace Navigator
Like a bratty teenager, traditional monitoring answers your questions, but does so in a terse, unhelpful manner: Why is my page slow? Guess it’s the API call. It’s a 504 thing — you wouldn’t understand. Ok, so why is the API call slow? Ask your DB query. Gosh! You need a better conversation with your code — one which gives you contextual clues about your application’s performance.
Application Monitoring 101: How to gain a better understanding of your endpoints using Trace View
How to Monitor Application Logs
Understanding and Debugging Applications Using Traces
Collecting Kafka Performance Metrics with OpenTelemetry
In a previous blog post, "Monitoring Kafka Performance with Splunk," we discussed key performance metrics to monitor different components in Kafka. This blog is focused on how to collect and monitor Kafka performance metrics with Splunk Infrastructure Monitoring using OpenTelemetry, a vendor-neutral and open framework to export telemetry data. In this step-by-step getting-started blog, we will.
Two Quick Ways to Create Spans with Kamon Telemetry
If you already had some experience with Kamon, you probably saw Kamon create Spans automatically for a lot of stuff, including HTTP server requests, database calls, actor messages, and more. But what happens when you want to create Spans for methods or code blocks that Kamon doesn’t instrument automatically? Let’s look at the two simplest ways to create Spans programmatically with Kamon.


