Operations | Monitoring | ITSM | DevOps | Cloud
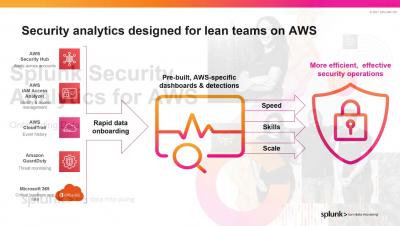
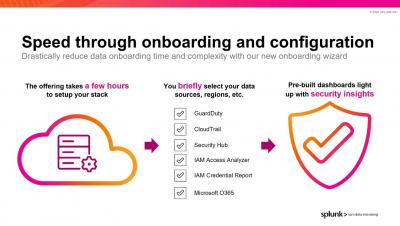
Detecting and Investigating Threats in Splunk Security Analytics for AWS
Easily ingest data to Elastic via Splunk
As organizations migrate to Elastic from incumbent vendors, quickly onboarding log data from their current solution into Elastic is one of the first orders of business. Data onboarding often involves having to adjust ingestion architecture and implement configuration changes across data sources. We want to ensure that users trialing or migrating to Elastic can get data in quickly to start seeing the power of Elastic solutions as quickly as possible.
New in Kibana: How we made it easier to manage visualizations and build dashboards
Our Kibana team has been hard at work implementing and executing on a new Kibana strategic vision to streamline the dashboard creation process and sand down the rough edges of creating visualizations for dashboards. We accomplished our goal and reduced the overall time it takes users to go from a blank slate to a meaningful dashboard that conveys insights about the data.
Splunk Workload Pricing For the Win!
We at Splunk know that data drives better decisions. We see this with customers, and we live it every day in our own operations within Splunk. Running large cloud services across multiple cloud providers, we have to manage data policies and data processing needs against an increasing set of use cases, as well as the backdrop of regulatory, privacy and security frameworks.
How To Fix Spark Performance Issues Without Thinking Too Hard
Big Data Cloud Performance Monitoring In The Cloud: Best Practices
How To Manage Big Data Analytics In The Cloud: Best Practices
The Future Trends of Big Data, Analytics and Cloud Adoption in 2021
Embedded Analytics for IT
When we hear the term ‘embedded analytics’, most people think of business intelligence. The concept of embedded analytics refers to the integration of analytic content and capabilities within a business process application. The business benefits of embedding analytics into a business process include increased visibility, more effective strategic planning and accelerated time to value.


