The latest News and Information on Containers, Kubernetes, Docker and related technologies.
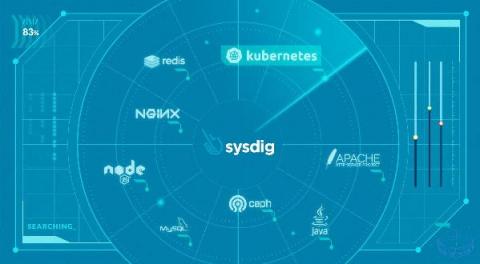
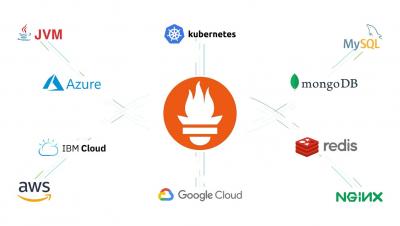
Monitoring services and applications in just a few clicks – that’s the dream of every SRE and developer, but this is very difficult because most applications don’t expose metrics in a standardized format. This article will introduce the current pros and cons of the Prometheus exporters ecosystem and how we leveraged the power of the open-source exporters in Sysdig to radically simplify the user experience to allow you to monitor your applications in just a few clicks.
Last year we cooked a holiday ham using Sysdig. Honestly, just revisiting that makes me hungry, but it got me thinking. What about dessert? Today, I’d like to discuss baking a pie and eating it with Prometheus Remote Write. But not just any pie: a Raspberry Pi. Specifically, I’d like to introduce you to Pi-hole, an open-source project that has become very popular in the community. In this article you’ll learn how easy is Monitoring Pi-hole with Prometheus Remote Write.
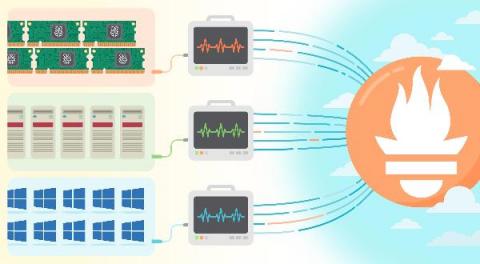
We are excited to announce that Prometheus Remote Write functionality is now generally available in Sysdig Monitor. This feature allows Prometheus users to easily push metrics directly from their Prometheus servers to Sysdig’s Managed Prometheus Service. Sysdig Monitor provides not only a scalable long term storage solution for custom metrics but also radically simplifies Prometheus monitoring.
Qovery is a continuous deployment platform. Users deploy apps of all kinds, written in any language and framework they choose. The freedom users have come with a cost for the Qovery core team - the broad scope Qovery has to cover, makes it harder to make the deployment process stable and straightforward for everybody. It's easy to create a service focused on just one language or framework - supporting all of them requires considering many more factors.
Kubernetes is the de-facto platform for orchestrating containerized workloads and microservices, which are the building blocks of cloud-native applications. Kubernetes workloads are highly dynamic, ephemeral, and are deployed on a distributed and agile infrastructure. Although the benefits of cloud-native applications managed by Kubernetes are plenty, Kubernetes presents a new set of observability challenges in cloud-native applications. Let’s consider some observability challenges.
Komodor is a Kubernetes-native platform we’ve created to streamline troubleshooting. It was born out of frustrations we felt as developers, when we were required to waste hours of our time on troubleshooting, instead of focusing on what we really wanted to do - creating and innovating. Komodor sits on top of your K8s cluster and integrates with every existing tool you have, be it CI/CD, repo, monitoring, alerting, or communication.
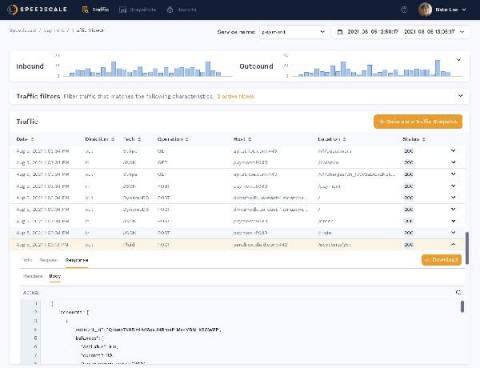
We are excited to announce a new global release of our software with unique API visibility features to help organizations discover problems with their cloud services well before they impact customers in production.