Dashboards

Grafana Play updates: recent growth, new privacy policies, and more

It’s hard to believe Grafana Play has been around for almost a decade. The platform continues to be a great way to demo Grafana, play around with new features, learn what’s possible, and simply have fun with data. Grafana Play provides a publicly available version of Grafana Cloud, and requires no login for access. It’s preloaded with a wide range of sample dashboards that teach users how to work with data sources, create visualizations, and explore advanced Grafana features.

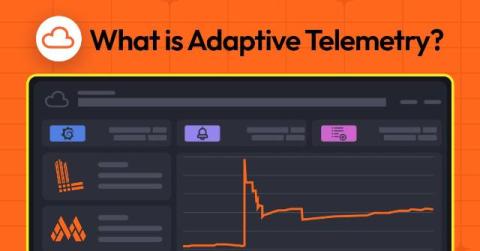
What is Adaptive Telemetry, and how can it reduce MTTR, noise, and cost?

As your applications scale, so too does the flood of logs, metrics, profiles, and traces—along with the costs to store and manage them. Collecting everything might feel like the safest bet, but it often leaves you buried in noise and struggling to find the signals that matter, all while costs spiral out of control.

Grafana SLO: Easily predict the likelihood that you'll hit your target

Service-level objectives (SLOs) can be a great way to ensure you’re hitting your goals, but many software teams struggle to set realistic targets when they first set up the service-level indicators (SLIs) that underpin those efforts. Sometimes management has a decree that all services will operate with “three 9s” of availability; other times engineers pick a number out of thin air.

Optimize Observability and Cut Costs Without Losing Insights | What is Adaptive Telemetry? | Grafana

Managing telemetry can quickly spiral out of control, leading to ballooning costs and overwhelming data volumes. But what if you could save time, reduce costs, and maintain the critical insights your team relies on? In this video, learn how Adaptive Telemetry helps you: Sign up for a free Grafana Cloud account today and unlock the potential of distributed tracing in your performance testing workflow.

OpenTelemetry and Grafana Labs: what's new and what's next in 2025

As the new year rolls in, it’s a great time to reflect and think big. What were some of your notable achievements in 2024, and what are your goals for 2025? We often do this in our personal lives — but why not apply this same line of thinking to observability, as well?

How to send OTLP or Prometheus metrics and logs to Grafana Cloud with Grafana Alloy

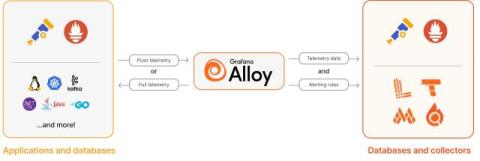
We introduced Grafana Alloy last year in an effort to create the best possible open source “big tent” telemetry collector. A continuation of our work on Grafana Agent Flow, we designed Alloy to simplify observability at scale and to easily integrate with the OpenTelemetry and Prometheus ecosystems. We’ve seen lots of interest since Alloy was announced at GrafanaCON 2024, and industry observers are taking notice, too.

Kibana vs. Grafana - A Scenario-Based Decision Guide [2025]

Both Kibana and Grafana are data visualization tools providing users capabilities to explore, analyze and visualize data with dashboards. The difference between Kibana and Grafana lies in their genesis. Kibana was built on top of the Elasticsearch stack, famous for log analysis and management. In comparison, Grafana was created mainly for metrics monitoring supporting visualization for time-series databases.

How CERN uses Grafana and Mimir to monitor the world's largest computer grid

The European Organization for Nuclear Research (CERN) is famous for operating the world’s largest particle accelerator, but did you know that CERN is also at the heart of the world’s largest computing grid? And with such unprecedented computing demands comes some serious observability needs.