Grafana v5.2 Released
The recent 5.1 release focused on smoothing out the rough edges from the 5.0 release. The major highlights of the Grafana 5.2 release are these two much-requested, long-awaited features.
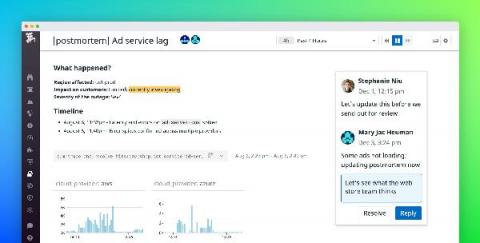
An incident postmortem is an excellent framework for learning from incidents and turning problems into progress. It also builds trust with customers, colleagues, and end users (basically the folks affected by the incident) and lets them know your team is working to minimize future incidents and impact.
Microsoft recently released Azure Kubernetes Service (AKS), a managed service that helps you deploy, run, and scale Kubernetes clusters. We’re pleased to share that Datadog’s integrations with Kubernetes and Azure Monitor can give you comprehensive visibility into your AKS infrastructure with no additional configuration.
You know what’s not fun for DevOps engineers? Manually investigating and troubleshooting issues within their applications. It’s also no longer feasible in today’s highly complex and fast moving IT landscape. Gone are the days of using legacy on-premises tools for modern applications and infrastructures because they simply aren’t compatible.
The healthcare industry is currently laden with pagers. The joke is that not even drug dealers use pagers any more. However, almost 80% of doctors do use pagers. The main problems with pagers is that they impede efficient clinical communications and lack security. Here are 6 ways to improve clinical communications.
We've rolled out a bunch of new features designed to make it quicker and easier to monitor large numbers of websites - you can now add, edit and delete website monitors in bulk. Thanks to everyone who have submitted feature requests - this helps us focus the development of Downtime Monkey on the areas that you want.
With millions of downloads for its various components since first being introduced, the ELK Stack is the world’s most popular log management platform. In contrast, Splunk — the historical leader in the space — self-reports 15,000 customers total. But what exactly is ELK, and why is the software stack seeing such widespread interest and adoption? Let’s take a deeper dive.
Kibana 6.3 was released a few weeks ago, together with new versions of Elasticsearch, Logstash and Beats, and despite the fact that this was not a major release, the new capabilities included in this version definitely deserve a close look.
ServiceDesk Plus users can now use an AD management plug-in to create and manage Active Directory (AD) users from the ServiceDesk Plus console. This plug-in will automatically add all AD user management actions to this help desk tool’s service catalog. Beyond technicians logging into ServiceDesk Plus to execute requests, regular users can access the tool to raise requests for user management actions.
RapidSpike the web and real user application monitoring, analytics and security solution based in Leeds have appointed Gav Winter as their new Chief Executive Officer.