Operations | Monitoring | ITSM | DevOps | Cloud

Datadog's KubeCon 2020 guide

The CNCF’s KubeCon North America 2020 is the premier event for adopters and technologists to learn about and work with the Kubernetes community—and it’s coming up in just a few days. With so much to do and learn within a short period of time, it can be challenging to know where to focus your time. Now that we’re living in an age of all-virtual conferences, that challenge has only increased.


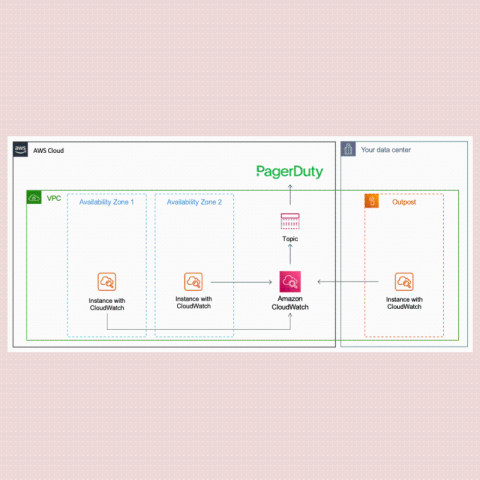
Manage CloudFront real-time logs in Datadog

Amazon CloudFront is a content delivery network (CDN) that minimizes latency by caching your content on AWS edge locations around the world. With CloudFront real-time logging, you can understand how efficiently CloudFront is distributing your content and responding to requests. You can collect CloudFront real-time logs in Datadog—in addition to CloudFront metrics—to get deep visibility into the health and performance of your CloudFront distribution.

Monitor MarkLogic with Datadog

MarkLogic is a multi-model NoSQL database with support for queries across XML and JSON documents (including geospatial data), binary data, and semantic triples—as well as full-text searches—plus a variety of interfaces and storage layers. Customers include large organizations like Airbus, the BBC, and the U.S. Department of Defense. Because MarkLogic can process terabytes of data across hundreds of clustered nodes, maintaining a deployment is a complex business.

Alert Fatigue | Are You a DevOps Zombie?

George Romero’s zombie classic, Dawn of the Dead, is the perfect analogy for a lot like the DevOps experience. Your cluster of services is like your Monroeville Mall. Your safe haven where you live and work for years on end, toiling away at survival. But who are the zombies? The answer isn’t always clear when you’re busy chasing down alerts at 2 AM.

How to Use Monitoring Analytics for Data-Driven Decision Making

Data-driven decision-making is a method based on identifying and analyzing critical metrics and figures to gain insights about key issues and produce a workable solution. An essential aspect of this decision-making process is monitoring analytics that serves to quantify the performance of interconnected systems and resources for enhanced performance visibility and informed decision-making.

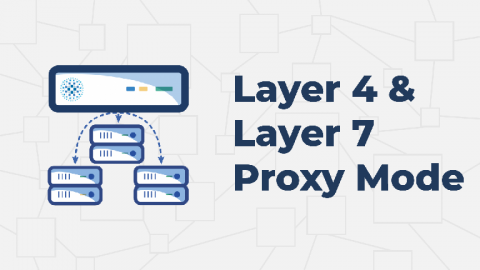
Layer 4 and Layer 7 Proxy Mode

HAProxy can run in two different modes: TCP or HTTP. When operating in TCP mode, we say that it acts as a layer 4 proxy. In HTTP mode, we say that it acts as a layer 7 proxy. To understand the difference, you must first learn about the Open Systems Interconnection (OSI) model, which helps IT pros conceptualize and explain where a piece of software fits in the context of a computer network.

4 Ways Cloud Costs Should Influence Your SaaS Pricing and Product Roadmap Strategy

On a day-to-day basis, both engineering and product management in software companies involves constant trade-offs. Everyone has a long backlog of tasks and needs to make decisions about what to prioritize on a daily, weekly, and monthly basis. Figuring out what to tackle first, what to put off for later, and what to say no to is critical both to managing daily workloads as well as to creating product roadmaps that reflect what customers want.

What challenges does IT monitoring face?

“The big challenge is to become all you could possibly be”, Jim Rohn. “The only way to grow is to challenge yourself,” Ashley Tisdale. “The bigger the obstacle, the more glory there is in overcoming it”, Molière… And so we could continue with a long list of inspiring and fighting-spirited people who faced life and came out victorious (probably). Pandora FMS is the same. Unbreakable and litigant.