As part of a challenge, I read Ulysses by James Joyce. 😬 Never again. At almost 1,000 pages (although about 250 of those pages were just explanatory notes), it was tough going. Especially when some bits of it were written in Latin, Irish, and Hungarian. I may have skimmed parts. At 42 pages, the Microsoft SQL Server 2019 Licensing Guide is no Ulysses, and it does have the benefit of being written in a single language. But it’s still not an easy read for us mere mortals.
The huge shift to remote work this year has presented many new challenges for IT teams—not least of which is the issue of securing the organization when large numbers of employees are now working at home. At PagerDuty, around a fifth of our employees were already based remotely, but the impact of COVID-19 meant that hundreds of other Dutonians had an almost-overnight switch to working away from the office.
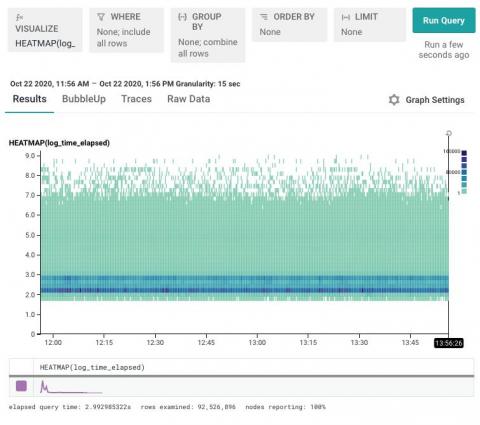
We often say that Honeycomb helps you find a needle in your haystack. But how exactly is that done? This post walks you through when and how to visualize your data with heatmaps, creating a log scale to surface data you might otherwise miss, and using BubbleUp to quickly discover the patterns behind why certain data points are different.
Welcome back! In the last blog we set up bidirectional communication between ServiceNow and Elasticsearch. We spent most of our time in ServiceNow, but from here on, we will be working in Elasticsearch and Kibana. By the end of this post, you'll have these two powerful applications working together to make incident management a breeze. Or at least a lot easier than you may be used to!
The Internet of Things (IoT) is a term for the ever growing number of internet connected devices that fall beyond the realm of your typical laptop, desktop computer or smartphone. Many of us already own and use IoT devices on a daily basis, these could be anything from "smart" versions of appliances like refrigerators, thermostats and coffee machines through to your expected IoT devices such as Amazon’s Alexa & Google’s home speakers.
As my co-founder Caleb Hailey likes to say, collecting monitoring and observability data is essentially a solved problem. The only remaining challenges are related to getting that data where you want it to go. When dealing with different formats — say, collecting Prometheus metrics and storing them in Elasticsearch — this can be a non-trivial problem. Put simply, it’s like trying to put a square peg into a round hole.
It’s been just over six months since Splunk disrupted the Application Performance Monitoring (APM) market with the launched SignalFx Microservices APM, combining the technologies of SignalFx and Omnition. We have pushed ourselves harder and continued to invest in creating more value for our customers by making it easier for them to ingest ALL data and providing ever more powerful analytics on top of that data.