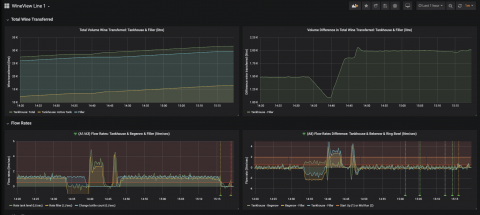
The below screen shots were provided by a large non-profit healthcare organization that includes 4 acute care hospitals, over 20 clinics and 5,000 Citrix users. The Healthcare IT team received reports from clinicians about slow logon times. This document describes how the Citrix engineer used Goliath Performance Monitor to pinpoint and troubleshoot the “Citrix is Slow” complaint and implement a fix action that permanently resolved the issue while reducing logon times by more than 80%.
We’ve said it before, and we’ll say it again — teamwork makes the dream work. Nothing quite says teamwork like a software development project management tool that focuses heavily on enabling every person on every team to work collaboratively. In this case, that tool is Clubhouse, who also just happens to be an early adopter for the Sentry Integration Platform.
Microservices and containers multiplied the complexity of Ticketmaster’s software system. Its engineers solved their debugging problems with Jaeger, an open-source tracing tool from Uber incubating at CNCF.
The below screen shots were provided by a large non-profit healthcare organization that includes 4 acute care hospitals, over 20 clinics and 5,000 Citrix users.
The Trade Desk provides a self-service, cloud-based platform for buyers of online advertising. Since its founding in 2009, TTD has grown into a publicly traded company with more than 900 employees and a market cap of $8.89 billion. The company recently moved from an old monitoring system based on Nagios, Graphite, and a number of homegrown pieces of software, to something more standard, based on Prometheus.
SevOne, a 14-year-old company in the network monitoring space, started using Grafana for self-monitoring last year because there weren’t many frontend engineers in the organization at the time. “We fell in love with it,” SevOne Tech Lead Sean Lafferty said during his GrafanaCon talk about how the company live streams Grafana data sources.