Operations | Monitoring | ITSM | DevOps | Cloud

Latest Posts

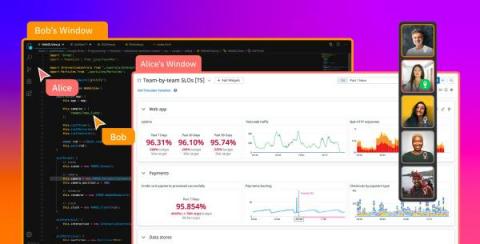
Tracing without Limits: live-query all traces, retain only the ones you need

Tracing is a critical part of monitoring application performance, especially as organizations shift to deploying services using distributed systems, serverless computing, and containerized environments. Teams need real-time, end-to-end visibility into all of the traces relevant to performance issues such as an application outage or an unresponsive service, but managing tracing costs often results in gaps in valuable tracing data.

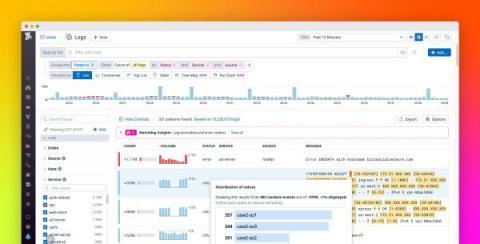
Add more context to your logs with Enrichment Tables

Logs provide valuable information for troubleshooting application performance issues. But as your application scales and generates more logs, sifting through them becomes more difficult. Your logs may not provide enough context or human-readable data for understanding and resolving an issue, or you may need more information to help you interpret the IDs or error codes that application services log by default.

Managing Datadog with Terraform

Terraform is an increasingly popular infrastructure-as-code tool for teams that manage cloud environments spanning many service providers. New users are often drawn to Terraform’s ability to quickly provision compute instances and similar resources from infrastructure providers, but Terraform can also manage platform-as-a-service and software-as-a-service resources.

Streamline communication workflows with the Datadog Slack App

Sharing information about the health and performance of an application is a critical part of any team’s daily workflow. That’s why we’re excited to announce the Datadog Slack App, which simplifies crucial communication tasks by deepening the integration between Datadog and Slack.

Watchdog surfaces root cause insights and Kubernetes anomalies

Since 2018, Watchdog has provided automatic anomaly detection to notify you of performance issues in your applications. Earlier this year, we introduced Watchdog for Infra, enhancing Watchdog to also monitor your infrastructure. We’re pleased to announce the latest enhancements to Watchdog, which now provides more visibility and greater context around the full scope of each application issue.

Monitor code deployments with Deployment Tracking in Datadog APM

Continuous integration and continuous delivery (CI/CD) pipelines have become fundamental to modern software development and code deployment. Implementing CI/CD practices can let teams deploy code more quickly and efficiently. But with these methods come a number of new challenges: bad code deploys are a major source of downtime and can lead to a loss of revenue and customer trust.

Monitor Auth0 with Datadog

Auth0 provides identity as a service (IDaaS), allowing you to secure your apps and APIs without having to write your own authorization code. Auth0 can work with social identity providers (IdP) like Google and Facebook so your users can access your app by using their existing accounts for authentication. You can also use an existing enterprise identity provider (e.g., LDAP) to allow your users to leverage single sign-on (SSO) across multiple apps.

How to monitor istiod

Istio is a service mesh that enables teams to manage traffic in distributed workloads without modifying the workloads themselves, making it easier to implement load balancing, canarying, circuit breakers, and other design choices. Versions of Istio prior to 1.5 adopted a microservices architecture and deployed each Istio component as an independently scalable Kubernetes pod. Version 1.5 signalled a change in course, moving all of its components into a single binary, istiod.

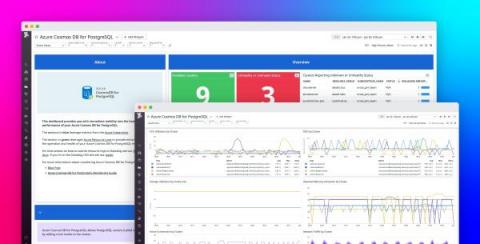
New Microsoft partnership embeds Datadog natively in the Azure portal

We are excited to announce a new partnership with Microsoft Azure, which has enabled us to build streamlined experiences for purchasing, configuring, and managing Datadog directly inside the Azure portal. This first-of-its-kind integration of a third-party service into a public cloud provider reduces the learning curve for using Datadog to monitor the health and performance of your applications in Azure—and sets you up for a successful cloud migration or modernization.

Best practices for monitoring AWS CloudTrail logs

Engineering teams that build, scale, and manage cloud-based applications on AWS know that at some point in time, their applications and infrastructure will be under attack. But as applications expand and new features are added, securing the full scope of an AWS environment becomes an increasingly complex task. To add visibility and auditability, AWS CloudTrail tracks the who, what, where, and when of activity that occurs in your AWS environment and records this activity in the form of audit logs.