Operations | Monitoring | ITSM | DevOps | Cloud

Latest Posts

Tags: set once, access everywhere

Tags are essential for aggregating and contextualizing monitoring data across your infrastructure; they enable you to monitor your entire system at a high level, drill down to individual services for more comprehensive analysis, and easily correlate data from every application component. Implementing a consistent and effective tag schema for your applications can be challenging, especially as they grow in complexity.

Add Datadog alerts to your xMatters incident workflows

xMatters provides flexible, smart tools for incident response and management. With configurable workflows that bring together data from sources like Github, Jenkins, and Zendesk, you can automate crucial tasks and send enriched notifications to streamline team communications.

Introducing Boolean-filtered metric queries

Health and performance issues are easier to understand—and to troubleshoot—when you can use tags to aggregate your data across many overlapping scopes. But while some scopes come directly from your infrastructure, others are constantly evolving to reflect the needs of your product or organization. You can only track your data effectively if you can define—and redefine—your scopes on the fly.

Monitor Alcide kAudit logs with Datadog

Kubernetes audit logs contain detailed information about every request to the Kubernetes API server and are critical to detecting misconfigurations and vulnerabilities in your clusters. But because even a small Kubernetes environment can rapidly generate lots of audit logs, it’s very difficult to manually analyze them.

Monitor AWS Step Functions with Datadog

AWS Step Functions is a service that abstracts distributed applications into state machines, with each state representing a component of an application. Not only does this automatically generate an architectural diagram of your application’s workflow, it also makes it straightforward to reorder your states as well as implement parallel execution, retries, and other tasks.

Monitor containers on Amazon Bottlerocket with Datadog

Amazon’s Bottlerocket is a new Linux-based open-source operating system that’s designed with containers in mind. Bottlerocket is optimized and stripped down to only the essential software needed to run containers. You can apply updates to Bottlerocket in a single step, and roll them back instantly if necessary. And, because it’s open-source, you can customize the operating system to fit your specific needs.

Monitor AWS GovCloud (US) with Datadog

Public sector organizations face a unique challenge when it comes to the cloud: how can they successfully migrate their operations while maintaining an air-tight, heavily regulated, massively distributed environment? To solve this problem, Amazon created the AWS GovCloud (US), two isolated Regions in the AWS ecosystem that are only accessible to US customers who meet strict security and compliance standards.

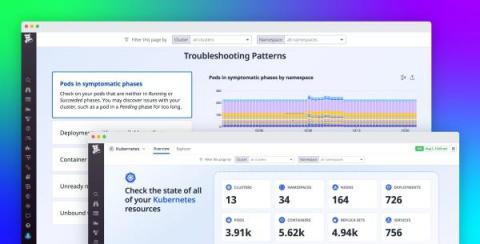
Explore Kubernetes resources with Datadog Live Containers

Running Kubernetes applications requires visibility into not only the overall performance of clusters but also the health of individual pods, deployments, and other resources that make up your environment. Datadog already integrates with your containerized environments and includes features like the Live Container view and the Container Map, enabling you to easily monitor Kubernetes and container runtime performance in real time and get deep visibility into clusters.

Analyze code performance in production with Datadog Continuous Profiler

To complement distributed tracing, runtime metrics, log analytics, Synthetic Monitoring, and Real User Monitoring, we’ve made another addition to the application developer’s toolkit to make troubleshooting performance issues even faster and simpler. Continuous Profiler is an always-on, production code profiler that enables you to analyze code-level performance across your entire environment, with minimal overhead.

Make sense of application issues with Datadog Error Tracking

When your applications raise errors, you need a way to make sense of them so you can set priorities, start troubleshooting, and gauge the success of your efforts. Errors can appear within the thousands of browser sessions and backend hosts running your software, making it difficult to find meaning within the noise. This is especially true of frontend errors, where seemingly endless permutations of browser version, location, and other environmental details can make it hard to spot trends.