Operations | Monitoring | ITSM | DevOps | Cloud

Latest News

[OpsComm June] Driving Real Business Value with the OpsRamp Cost Savings Calculator

June 2019 saw the launch of The OpsRamp Cost Savings Calculator, a simple and powerful tool which helps IT experts quantify how much they can save with OpsRamp's service-centric AIOps platform. Our field marketing team had a blitz with two major events - HPE Discover and CloudExpo Santa Clara where we showcased our AIOps and hybrid IT monitoring capabilities. June also saw our resident experts making several contributions across different media outlets and events.

Docker Build: A Beginner's Guide to Building Docker Images

Docker has changed the way we build, package, and deploy applications. But this concept of packaging apps in containers isn’t new—it was in existence long before Docker. Docker just made container technology easy for people to use. This is why Docker is a must-have in most development workflows today. Most likely, your dream company is using Docker right now. Docker’s official documentation has a lot of moving parts. Honestly, it can be overwhelming at first.

5 Most Common Web Application Attacks and How to Defend Against Them

Globally, cybercrime was the second most reported crime in 2016, and cybercrime damages are anticipated to cost businesses and organizations $6 trillion annually by 2021. One of the ways that cybercriminals attack businesses is through the use of web application vulnerabilities. A web application vulnerability is a flaw or loophole in an application’s code that can be exploited by attackers to facilitate cybercrime. Imperva reports that web application vulnerabilities are on the rise.

Agent Smith materializes from the matrix of Android malware

There’s a new shapeshifting strain of Android malware in the mix. It replaces legitimate apps with compromised ones and is imaginatively named Agent Smith after the iconic villain in The Matrix. Yet another malware attack targeting Android—so what’s the big deal? Agent Smith is similar to other malware campaigns such as Gooligan, HummingBad, and CopyCat with respect to the destruction it can cause via fraudulent ads.

Automate workflows with Datadog's Amazon EventBridge integration

Amazon EventBridge is a serverless event bus that routes real-time data streams from your applications and services to targets like AWS Lambda. EventBridge facilitates event-driven application development by simplifying the process of ingesting and delivering events across your application architecture, and by providing built-in security and error handling. We are excited to announce that you can now use our new integration to route Datadog alerts to EventBridge with minimal configuration or setup.

PerfOps FlexBalancer Raw Logs

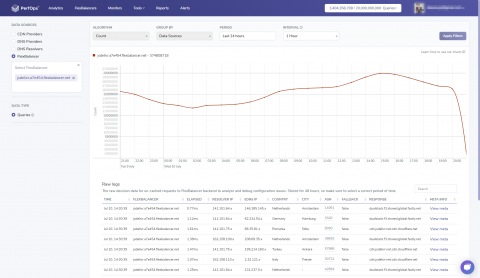
Our latest product release contains plenty of new features, so we decided to list the major ones that our users will find most exciting. We now make it even simpler to debug your load-balancing by providing access to raw logs for FlexBalancer. All requests hitting our backend are now logged and available for analysis by our customers directly on the Analytics page. When you setup complex load-balancing rules it could be hard to understand how it will perform in some rare use-cases.

Cross-tenant monitoring with Azure Lighthouse and Datadog

Azure Lighthouse is a new feature that provides improved access management for users and applications across different Azure tenants. With Azure Lighthouse, managed service providers (MSPs) can manage their customers’ environments more easily and efficiently than ever before. Datadog is proud to announce support for Azure Lighthouse, which ensures that MSPs can implement a streamlined, scalable approach to monitoring their customers’ Azure environments.

A Guide to Open Source Monitoring Tools

Open source is one of the key drivers of DevOps. The need for flexibility, speed, and cost-efficiency, is pushing organizations to embrace an open source-first approach when designing and implementing the DevOps lifecycle. Monitoring — the process of gathering telemetry data on the operation of an IT environment to gauge performance and troubleshoot issues — is a perfect example of how open source acts as both a driver and enabler of DevOps methodologies.

What do these error codes mean?

The other day whilst using a very popular website I came across a series of 404 unavailable page messages. I didn’t think much about it at the time but on reflection it made me wonder how many people actually understand what different error codes mean? Hands up, I only know a few and I work in the website monitoring sector. To most, it just means a weird IT message when things go wrong.