Operations | Monitoring | ITSM | DevOps | Cloud

Latest News

Why Stack Trace APM Isn't Enough for Complete Web Application Monitoring

It’s probably true to say that if you asked an average user what makes a great web application, they’d probably say “speed.” But speed is the probably the least important aspect of an extensive rundown of elements. Factors like application development and rendering in the program are probably higher on that list. And what makes up a great performing application? And when something goes wrong, how do you know?

Citrix Analytics for Performance - Where does it fit in relation to Citrix Performance Monitoring and Management?

I recently published an article on Citrix Performance Analytics (also called Citrix Analytics for Performance), part of the Citrix Analytics service in Citrix Cloud. In this article, i will analyze where Citrix Performance Analytics fits in relative to other Citrix performance monitoring and management tools in the market.

Synthetic Monitoring vs. APM Stack Trace Tools

The complexity of an application’s digital architecture is increasing dramatically every day. In an era of cloud infrastructure, the goal is to integrate all your web services into one place: CDN, DNS, third-party API services, QA tools, analytics tools, and any other component you can think of, are working with each other to make your services function. With so many components in place for an application to run, each one of these behaves like its own black box within your IT infrastructure.

How to easily correlate logs and APM traces for better observability

Application performance monitoring (APM) and logging both provide critical insight into your ecosystem. When paired together with context, they can provide vital clues on how to resolve problems with your applications. As the log data you analyze becomes more complex, navigating to the relevant pieces can be tricky using traditional tools. With Elastic Observability (powered by the Elastic Stack), correlating logs with APM is as simple as a few clicks in Kibana.

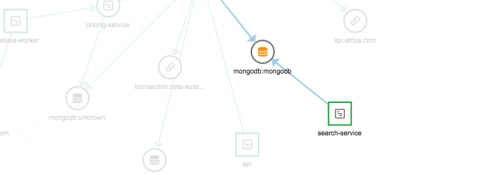
AppOptics Application Service Map

Announcing automatic dependency mapping in SolarWinds AppOptics When your team responds to a latency alert on a single service, how do they know how (or if) the increased latency in one service affects the end user? With the SolarWinds® AppOptics™ service map, teams can easily view the relationships between services, and see how (or if) a service is connected to the end user.

ManageEngine recognized in Gartner Magic Quadrant for Application Performance Monitoring

We are happy to announce that ManageEngine has been recognized by Gartner in its 2020 Magic Quadrant for Application Performance Monitoring. Applications Manager has helped thousands of customers across the globe streamline and manage their servers and applications effectively.

How to Monitor Citrix Remote PC

Ever since the beginning of the COVID-19 pandemic and the resulting lockdowns, working from home has instantly become the primary way of work for most people. Even companies that already had functionality in place to work from home were instantly hit by scalability issues. Many of the existing solutions typically weren’t meant to be used for a 100% concurrent remote workforce.