Operations | Monitoring | ITSM | DevOps | Cloud

Latest News

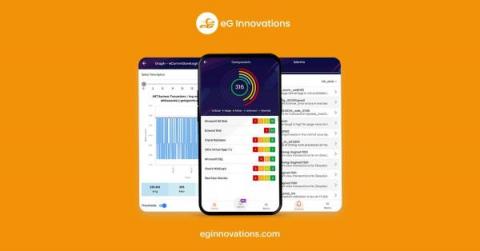
Exciting New Additions to the eG Enterprise Mobile Application

Our latest release of eG Enterprise, version 7.2 is accompanied by significant enhancements and new features for our popular eG Enterprise mobile app for iOS and Android. These apps allow administrators to access the eG Enterprise administrator console on the go and receive meaningful alerts and push notifications with click throughs to deep diagnosis rather than dumb text messages.

The Three Pillars of Observability: Metrics, Logs and Traces

Metrics, Logs and Traces are often referred to as The Three Pillars of “Observability“. The term observability has been used in control theory to refer to how the state of a system can be inferred from the system’s external outputs. Applied to IT, observability is how the current state of an application can be assessed based on the data it generates. Applications and the IT components they use provide outputs in the form of metrics, events, logs and traces (MELT).

Monitor your Nodejs application with OpenTelemetry and SigNoz

OpenTelemetry can auto-instrument many common modules for a Javascript application. The telemetry data captured can then be sent to SigNoz for analysis and visualization. OpenTelemetry is a set of tools, APIs, and SDKs used to instrument applications to create and manage telemetry data(Logs, metrics, and traces). For any distributed system based on microservice architecture, it's an operational challenge to solve performance issues quickly.

Java performance optimization tips: How to avoid common pitfalls

In this post, we’ll be delving into Java performance optimization, providing you with essential tips to write faster and more efficient code. If you’re reading this, you’re probably already aware of the importance of performance engineering and the need to optimize your code to ensure speed for all users, but even the most seasoned and performance-aware programmers can get tripped up.

Managing Monitoring and Alerting during IT Maintenance

Alerting is a critical feature in monitoring and observability products. The monitoring platform continually tests systems and applications for metrics crossing thresholds, key events in logs and the other warning signs of issues. Alerting ensures that help desks, administrators and IT Ops teams know about issues, or impeding issues and handle communications and remediation rapidly.

Set up application monitoring for your Node JS app in 20 mins with open source - SigNoz

In this article, learn how to setup application monitoring for Node.js apps with our open-source solution, SigNoz. Node.js tops the list of most widely used frameworks by developers. Powered by Google's V8 javascript engine, its performance is incredible. Ryan Dahl, the creator of Node.js, wanted to create real-time websites with push capability. On Nov 8, 2009, Node.js was first demonstrated by Dahl at the inaugural European JSconf.

A Comprehensive Comparison of New Relic and Scout APM

When it comes to getting to the root of a performance problem, nothing beats the lightning-fast speed and precision of Application Performance Management (APM). But choosing between New Relic and Scout can be like navigating a labyrinth of options and considerations. With New Relic, you'll get a top-of-the-line tool that's perfect for some situations, while Scout's streamlined approach fits like a glove in others.

12,000+ GitHub stars, better search capabilities, and a more intuitive Logs tab - SigNal 23

Welcome to our monthly product newsletter - SigNal 23! Last month, our team worked on improving the search capabilities across multiple tabs. We also made the logs tab more intuitive by adding color coding in the logs view. We presented SigNoz at an observability-focused meetup and crossed 12,000+ GitHub stars. Let’s dive in to see what humans at SigNoz were up to in the month of March 2023.
Sponsored Post

Building vs. buying a digital experience monitoring tool

It's usually possible, and often tempting, to build your own tools. For engineers in particular, there's a strong appeal to having total control over a custom-built product that will perfectly meet your specific requirements. Raygun itself originally came from an internal tool we built to monitor errors in a different product. But as our business matured and we started to think more strategically, we recognized the hidden, lingering costs to our DIY approach, and began to believe that internal tools were a misuse of the time and skills of our development team.

Citrix Logon Simulator Updates - eG Enterprise v7.2

Our latest release, eG Enterprise v7.2 has added a number of enhancements to our leading logon simulators. A large number of our Citrix customers rely on this popular tool to actively test and benchmark the speed and success of logons repeatedly even when no real users are accessing systems.