Operations | Monitoring | ITSM | DevOps | Cloud
Latest News
Deciding Whether to Buy or Build an Observability Pipeline
In today's digital landscape, organizations rely on software applications to meet the demands of their customers. To ensure the performance and reliability of these applications, observability pipelines play a crucial role. These pipelines gather, process, and analyze real-time data on software system behavior, helping organizations detect and solve issues before they become more significant problems. The result is a data-driven decision-making process that provides a competitive edge.
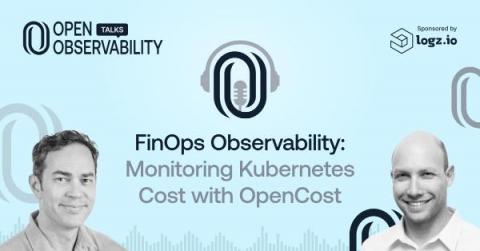
FinOps Observability: Monitoring Kubernetes Cost
With the current financial climate, cost reduction is top of mind for everyone. IT is one of the biggest cost centers in organizations, and understanding what drives those costs is critical. Many simply don’t understand the cost of their Kubernetes workloads, or even have observability into basic units of cost. This is where FinOps comes into play, and organizations are beginning to implement those best practice standards to understand their cost.
Elastic Synthetics Projects: A Git-friendly way to manage your synthetics monitors in Elastic Observability
Elastic has an entirely new Heartbeat/Synthetics workflow superior to the current workflow. If you’re a current user of the Elastic Uptime app, read on to learn about the improved workflow you can use today and should eventually migrate toward.
Distributed alerting with the Elastic Stack
Modern computing environments and distributed workforces have produced new challenges to traditional information security approaches. Many traditional threat detection and response strategies rely on homogeneous environments, system baselines, and consistent control implementations. These strategies have been built on traditional environment assumptions that may no longer be true in your environment with the evolution of cloud computing, remote work, and modern culture.
Importing your Cloudwatch Metrics into Prometheus
Cloudwatch is the de facto method of consuming logs and metrics from your AWS infrastructure. The problem is, it is not the de facto method of capturing metrics for your applications. This creates two places where observability is stored, and can make it difficult to understand the true state of your system. That’s why it has become common to unify all data into one place, and Prometheus offers an open-source, vendor-agnostic solution to that problem.
See how reliability management enhancements expand your SLO value
A new year with a new look and many more...
Simplified analysis. Enhanced visualizations, alerting capabilities, advanced data forwarding, and more. Great news! We have published a new update with many exciting new features and optimizations.
Business Resilience: How To Build Resilience Strategically, Tactically & Operationally
The ability to continue business operations for the foreseeable future is a key metric from a financial standpoint. But from a risk management perspective, all dimensions of an organization’s strategic and operational framework must be analyzed in order to… The last part relates to business resilience — and it’s what we’re going to explore here. (This article was written by Joseph Nduhiu. See more of Joseph’s contributions to Splunk Learn.)
What is Syslog and how does it work?
When you’re adding or subtracting fractions, you need to make sure that they have a common denominator, a number that allows you to compare values. In the same way, your IT environment needs a common “language” for your event log data. Your environment consists of various devices running different operating systems, software, and firmware.


