Operations | Monitoring | ITSM | DevOps | Cloud
Latest News
Loki vs Prometheus - Differences, Use Cases, and Alternatives
Beginner's Guide to Prometheus Metrics
Over the past decade, Prometheus has become the most prominent open source monitoring tool in the world, allowing users to quickly and easily collect metrics on their systems and help identify issues in their cloud infrastructure and applications. Prometheus was originally developed by SoundCloud when the company felt their metrics and monitoring solutions weren’t meeting their needs.
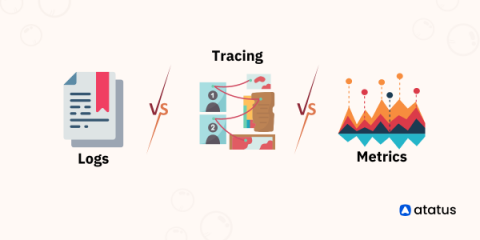
Logging, Traces, and Metrics: What's the difference?
Several tech giants like Amazon and Netflix have jumped from their monolithic applications to microservices. This has allowed them to expand their business interface tremendously and improve their services. Not only them, but most businesses today are dependent on microservices. Twitter currently has about a thousand such services working together, releasing meaningful outputs.
Structured, Unstructured & Semi-Structured Data
Why Culture and Architecture Matter with Data, Part I
We are using data wrong. In today’s data-driven world, we have learned to store data. Our data storage capabilities have grown exponentially over the decades, and everyone can now store petabytes of data. Let’s all collectively pat ourselves on the back. We have won the war on storing data! Congratulations!
It's time for government to move beyond monitoring and into observability
When thinking about holistic end-to-end observability, it can help to start with what you already have. Many government agencies are already strategically ingesting and storing logs — a key component of observability. More than a year and a half after the release of M-21-31, US government agencies continue to work through the logging maturity models outlined in the memorandum.
10 Best Log Management Tools
Logs are imperative for troubleshooting, performance analysis, health monitoring, and application integrity and security. Log management tools clearly understand how users interact with apps and systems and provide insight into improving software reliability, increasing productivity, reducing risks, and ultimately improving the user experience. Through log management tools, users can further integrate and enrich all of their logs, making queries quicker and more effective.
15 Best Tools to Test and Measure Core Web Vitals [2023 Comparison]
User experience is key to ensuring the success of your website. There are many metrics that help you gauge and improve it, but Core Web Vitals are probably the most important ones. They are a set of real-world, user-centered metrics that quantify key aspects of the user experience. By measuring dimensions of web usability such as load time, interactivity, and the stability of content as it loads, Core Web Vitals help you understand how your website is doing in terms of performance.
How we reduced flaky tests using Grafana, Prometheus, Grafana Loki, and Drone CI
Flaky tests are a problem that are found in almost every codebase. By definition, a flaky test is a test that both succeeds and fails without any changes to the code. For example, a flaky test may pass when someone runs it locally, but then fails on continuous integration (CI). Another example is that a flaky test may pass on CI, but when someone pushes a commit that hasn’t touched anything related to the flaky test, the test then fails.


