Operations | Monitoring | ITSM | DevOps | Cloud
Latest News
Eating Our Own Goat Food: Using Our Own Products
Here at Cribl, we’re big on GoatFooding. We not only prepare but consume our own products, in our own products. Today we’ll pull back the curtains to shine a light on how we use Cribl products within our Cribl.Cloud service. Cribl is a pioneer in the observability space, so what better way to use our products than by observing Cribl.Cloud?
observIQ awarded Fall 2022 Intellyx Digital Innovator Award
Searching Observability Data Just Became Point & Shoot
The traditional approach for searching observability data is a tried-and-true: Once all the search staging is accomplished, we can perform high-speed, high-performance, deep-dive analysis of the data. But is this the best way or even the only way to search all that observability data? The answer to the first question is maybe, as it depends on what you are trying to accomplish. The answer to the second question must be a resounding no.
Dashboard Design: Visualization Choices and Configurations
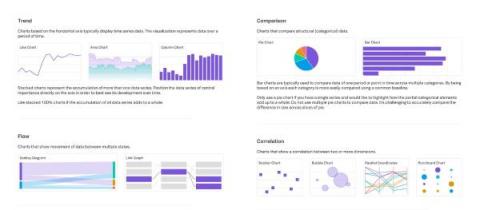
There are many visualization types and configurations available to choose from. In general, keep your visualizations as simple and straightforward as possible to avoid distraction and highlight only the most important information. If there is too much unnecessary information on the page it can be overwhelming and focus can be misdirected to unimportant details.
What Is Splunk & What Does It Do? An Introduction To Splunk
Hi! We’re Splunk, and we’re glad you’re visiting us today. Honestly, we hear from people far and wide about “What does Splunk do?”, “Does the name Splunk mean something?” And of course, “How can I learn Splunk?” I wrote this article to help answer all these questions for you and point you towards whatever question you want answered.
How to design a microservices architecture with Docker containers
Cribl.Cloud Is Now On AWS Marketplace!
As of 2022, 49% of enterprise workloads and data are in a public cloud, and that number is expected to increase by 6-7% over the next year. Why? With big cloud moves come big benefits: optimized performance, reduced management overhead, and cost savings on data centers. However, it also comes with the struggle to get a handle over never-ending data growth. Customers are looking to Cribl to help route and process that data at scale and need a seamless way to get started within minutes.
Grafana vs. Splunk
Are you trying to choose between Grafana and Splunk, but can't find enough information about their capabilities? In this blog, we highlight the details of why a user should select Grafana OR Splunk as part of their monitoring stack and what are the user benefits of each. Also, you can check out what it's like to make your own Grafana dashboard using our MetricFire free trial. Get onto the product in minutes and see if you prefer Grafana over Splunk.
Independence with OpenTelemetry on Elastic
The drive for faster, more scalable services is on the rise. Our day-to-day lives depend on apps, from a food delivery app to have your favorite meal delivered, to your banking app to manage your accounts, to even apps to schedule doctor’s appointments. These apps need to be able to grow from not only a features standpoint but also in terms of user capacity. The scale and need for global reach drives increasing complexity for these high-demand cloud applications.


