Operations | Monitoring | ITSM | DevOps | Cloud
Latest News
How to use Cribl Stream and ChaosSearch for Next-Gen Observability
The Leading Sumo Logic Alternatives
Using Sumo Logic, you can analyze both metrics and logs simultaneously. Developed in 2010, this solution provides a powerful query language and scheduling support. Sumo Logic's production monitoring features provide visibility into production issues. Instead of manually writing alerts, the platform offers pre-configured alert templates (which Logit.io also offers), which makes setting up alerts easier and faster.
A look under the hood at eBPF: A new way to monitor and secure your platforms
In this post, I want to scratch at the surface of a very interesting technology that Elastic’s Universal Profiler and Security solution both use called eBPF and explain why it is a critically important technology for modern observability. I’ll talk a little bit about how it works and how it can be used to create powerful monitoring solutions — and dream up ways eBPF could be used in the future for observability use cases.
One Click Visibility: Coralogix expands APM Capabilities to Kubernetes
There is a common painful workflow with many observability solutions. Each data type is separated into its own user interface, creating a disjointed workflow that increases cognitive load and slows down Mean Time to Diagnose (MTTD). At Coralogix, we aim to give our customers the maximum possible insights for the minimum possible effort. We’ve expanded our APM features (see documentation) to provide deep, contextual insights into applications – but we’ve done something different.
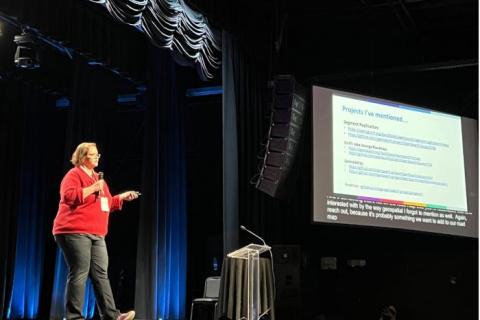
OpenSearchCon: Together after 18 Months
OpenSearch was created by the community for the community to continue to keep an open-source alternative to ElasticSearch and Kibana. The project has been hard at work for the last 1.5 years building, launching and iterating on this important initiative. Some remarkable milestones have been achieved, including over 5,800 stars on GitHub with 19 different community-led projects.
How to Monitor MongoDB: Key Metrics to Measure for High Performance
Monitoring distributed systems like MongoDB is very important to ensure optimal performance and constant health. But even the best monitoring tool will not be efficient without fully understanding the metrics it gathers and presents, what they represent, how to interpret them, and what they affect. That’s why it is crucial not only to collect the metrics but also to understand them.
Sumo Logic's investment in OTel
AWS Lambda Telemetry API: Enhanced Observability with Coralogix AWS Lambda Telemetry Exporter
AWS recently introduced a new Lambda Telemetry API giving users the ability to collect logs, metrics, and traces for analysis in AWS services like Cloudwatch or a third-party observability platform like Coralogix. It allows for a simplified and holistic collection of observability data by providing Lambda extensions access to additional events and information related to the Lambda platform.
How retailers are uncovering insights and driving more conversions this holiday season
This year, global ecommerce transactions are expected to grow by over 12% during the 2022 holiday season. As the industry continues to rely more on ecommerce, retailers are looking at new ways to improve customer experience and provide a safe and secure shopping journey. In an increasingly competitive space, many retailers are leveraging their data assets to accomplish more, spark innovation, create more personalized experiences, and drive higher conversion rates.


