Operations | Monitoring | ITSM | DevOps | Cloud

Latest News

Splunk Snags Six 'Best of' Awards From Customer Reviews on TrustRadius

Splunk is honored to be the recipient of a series of six new awards from TrustRadius—all based on customer reviews. In this round, TrustRadius grants its “Best of” Awards to the top three products per Best Feature Set, Best Value for Price and Best Relationship in each respective category.

Log Forwarding with HAProxy and Syslog

Developing a strategy for collecting application-level logs necessitates stepping back and looking at the big picture. Engineers developing the applications may only see logging at its ground level: the code that writes the event to the log—for example a function that captures Warning: An interesting event has occurred! But where does that message go from there? What path does it travel to get to its destination?

Alerting Techniques for an observable platform

Observable and secure platforms use three connected data sets: logs, metrics, and traces. Platforms can link these data to alerting systems to notify system administrators when an event requires intervention. There are nuances to setting up these alerts so the system is kept healthy and the system administrators are not chasing false positive alerts.

Introducing Splunk Operator for Kubernetes 2.0

The Splunk Operator for Kubernetes team is extremely pleased to announce the release of version 2.0! This represents the culmination of many months of work by our team and continues to deliver on our commitment to provide a high-quality experience for our customers wishing to deploy Splunk on the Kubernetes platform.

A Complete Guide to Tomcat Monitoring: How to, Metrics & Choosing the Best Tools

The Apache Tomcat is an open-source implementation of the Jakarta Servlet, Jakarta Server Pages, Jakarta Expression Language, Jakarta WebSocket, Jakarta Annotations and Jakarta Authentication specifications, all being a part of the Jakarta EE Platform. That is the official description of Apache Tomcat.

Get better visibility into DevOps performance in one place with Atlassian integrations

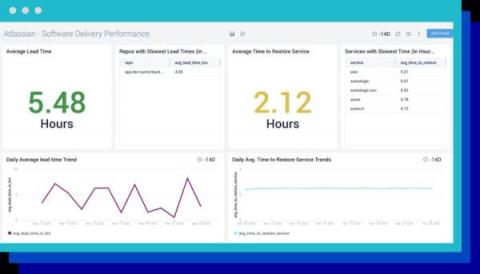
Every company is a software company and every company wants to get better at it. That’s why Sumo Logic built a set of integrations with Atlassian DevOps solutions. Leveraging data from Atlassian, Sumo Logic now enables you to visualize the key, actionable insights behind the DevOps Research Assessment (DORA) metrics to continuously improve your software delivery performance. Sumo Logic’s observability platform presenting Atlassian data brings the following benefits, to name a few.

Postcard From .conf22: Customers Inspire Our Latest Release

They say, “What happens in Vegas, stays in Vegas,” but I wanted to highlight the role our customers played at last month’s.conf22, our annual users’ event at the MGM Grand. It was awesome meeting customers in person again, and connecting virtually with thousands more. We had a terrific turnout with 8,200+ customers and partners representing 113 countries and more than 6,500 organizations.

Announcing the General Availability of Synthetic Monitoring Within Splunk Observability

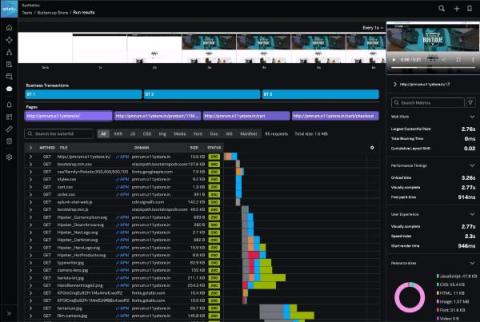
Today we’re proud to announce the general availability of best-in-class Synthetic Monitoring capabilities within Splunk Observability Cloud. Now, IT and engineering teams can proactively measure, monitor and troubleshoot their critical user flows, APIs and services, connected across Splunk Observability.

Cribl.Cloud Simplified with Consumption Pricing

One year ago, we launched Cribl.Cloud as a cloud-hosted option for our industry-leading data pipeline product, Cribl Stream. Customers had a choice of either deploying on-premises with a subscription-based tiered license model or opting for our cloud service with a similar tiered billing model. Fast-forward one year, and Cribl is now a multi-product company with several unique observability products (Stream, Edge, AppScope, and soon Search) to offer our customers.