Operations | Monitoring | ITSM | DevOps | Cloud

Latest News

A simplified stack monitoring experience in Elastic Cloud on Kubernetes

To monitor your Elastic Stack with Elastic Cloud on Kubernetes (ECK), you can deploy Metricbeat and Filebeat to collect metrics and logs and send them to the monitoring cluster, as mentioned in this blog. However, this requires understanding and managing the complexity of Beats configuration and Kubernetes role-based access control (RBAC). Now, in ECK 1.7, the Elasticsearch and Kibana resources have been enhanced to let us specify a reference to a monitoring cluster.

Avoid dropped logs due to out-of-order timestamps with a new Loki feature

Dropped log lines due to out-of-order timestamps can be a thing of the past! Allowing out-of-order writes has been one of the most-requested features for Loki, and we’re happy to announce that in the upcoming v2.4 release, the requirement to have log lines arrive in order by timestamp will be lifted. Simple configuration will allow out-of-order writes for Loki v2.4.

Security Hygiene - Why Is It Important?

“What happened?” If you’ve never uttered those words, this blog isn’t for you. For those of us in cybersecurity, this pint-sized phrase triggers memories of unforeseen security incidents and long email threads with the CISO. What happened to those security patches? Why didn’t we prevent that intrusion? Organizations tend to lean towards protecting their borders and less towards understanding the importance of overall security hygiene.

What's new in Elastic Maps: Maps tailored to your geospatial data

Sysadmins, cartographers, and dashboard designers can now personalize Elastic Maps to create richer geodata stories. The 7.14 release of Elastic Maps has the geo capabilities to highlight points of interest, hide unnecessary details, and help you explore new trends in your data. Elastic Maps is available now on Elastic Cloud — the only hosted Elasticsearch offering to include all of its latest features.

How to Log to Console in PHP and Why Should You Do It

Monitoring, troubleshooting, and debugging your code all require logging. It not only makes the underlying execution of your project more visible and understandable, but it also makes the approach more approachable. Intelligent logging procedures can assist everyone in a company or community to stay on the same page about the project's status and progress.

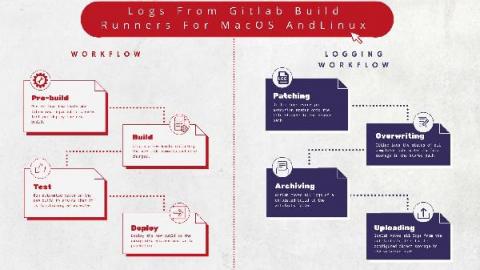
Logging Gitlab Runners for MacOS and Linux

Gitlab is the DevOps lifecycle tool of choice for most application developers. It was developed to offer continuous integration and deployment pipeline features on an open-source licensing model. GitLab Runner is an open-source application that is integrated within the GitLab CI/ CD pipeline to automate running jobs in the pipeline. It is written in GoLang, making it platform agnostic. It is installed onto any supported operating system, a locally hosted application environment, or within a container.

What is Splunk Virtual Compute (SVC)?

A Splunk Virtual Compute (SVC) unit is a powerful component of our workload pricing model. Historically, we priced purely on the amount of data sent into Splunk, leading some customers to limit data ingestion to avoid expense related to high volumes of data with low requirements on reporting. With Splunk workload pricing, you now have ultimate flexibility and control over your data and cost.

Workload Pricing and SVCs: What You Can See and Control

The Cloud Monitoring Console (CMC) lets Splunk Cloud Platform administrators view information about the status of a Splunk Cloud Platform deployment. For workload pricing, the CMC lets you monitor usage and stay within your subscription entitlement. From the CMC you can see both ingest and SVC usage information and can gain insight into how your Splunk Cloud Platform deployment is performing.

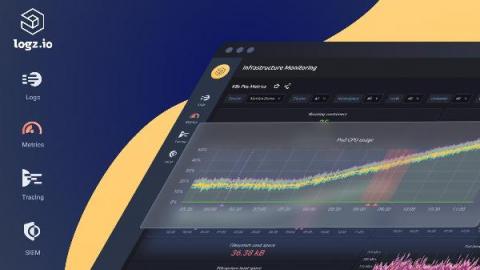
Logz.io's New Lookz is Generally Available!

Back in June, we announced the Public Beta for Logz.io’s New Lookz – which is a new UI that completely changes the way users navigate across Logz.io products and features. The Public Beta gave users the option to toggle between the old and new UIs to see which one they liked better. And the answer from our users was as clear as it could be.

Auto-Instrumenting Ruby Apps with OpenTelemetry

In this tutorial, we will go through a working example of a Ruby application auto-instrumented with OpenTelemetry. To keep things simple, we will create a basic “Hello World” application, instrument it with OpenTelemetry’s Ruby client library to generate trace data and send it to an OpenTelemetry Collector. The Collector will then export the trace data to an external distributed tracing analytics tool of our choice.