Operations | Monitoring | ITSM | DevOps | Cloud

Latest News

Why LogDNA Received the EMA Top 3 Award for Observability Platforms

We’re honored to be included in Enterprise Management Associates’ EMA Top 3 Award for Observability Platforms. This award recognizes software products that help enterprises reach their digital transformation goals by optimizing product quality, time to market, cost, and ability to innovate—all the things we’re passionate about at LogDNA.

How the French Ministry of Agriculture deploys Elastic to monitor the commercial fishing industry

Within the French Ministry of Agriculture and Food (the Ministry), our team of architects in the Methods, Support and Quality office (BMSQ) evaluate and supply software solutions to resolve issues encountered by project teams that affect various disciplines. As data specialists, one area we’ve been involved in includes reconfiguring the traceability of activities for the commercial fishing industry.

5 Best Tools for Log Collection and Archiving With Guide

Collecting and archiving logs is an essential practice for any organization looking to maintain the performance and security of their network. Logs are like a diary for your devices. They record every message sent from any of your network systems. This information can prove essential for everything from understanding the daily activities of your infrastructure, to improving functionality across your platforms, to identifying and troubleshooting issues.

Unexpected Parallels Between Yoga and Observability

Yoga is to ideal human health what observability is to an application’s ideal functioning. It is well established that observability is a critical factor for the successful implementation and maintenance of cloud-native, serverless, cloud-agnostic, and microservices-based applications. Well-established observability helps DevOps and development teams cross the boundaries of complex systems and get complete visibility into their functioning.

Telegraf Integrations with Logz.io

Logz.io is proud to announce a slew of new integrations via Telegraf. Logz.io utilizes Prometheus in its product, but aims to support compatibility across common DevOps tools. A number of our customers, and the community in general, are strong users of Telegraf and its companion apps in the TICK Stack (which includes InfluxDB). Telegraf is not as popular as Prometheus, but it’s a strong element in the DevOps toolbox.

Tutorial: Setting up AWS CloudWatch Alarms

AWS CloudWatch is a service that allows you to monitor and manage deployed applications and resources within your AWS account and region. It contains tools that help you process and use logs from various AWS services to understand, troubleshoot, and optimize deployed services. I’m going to show you how to get an email when your Lambda logs over a certain number of events.

ChaosSearch Named "Most Likely to be the Next Boston Unicorn" in Startup Boston's Community Awards

This week, ChaosSearch announced some exciting news -- we're honored to have been named Most Likely to be the Next Boston Unicorn in Startup Boston’s first-ever Community Awards! The award celebrates companies that have made extraordinary achievements in the startup ecosystem in Boston, and represents grassroots recognition from tech entrepreneurs, employees, investors, journalists, and educators in the region.

observIQ Cloud and the OpenTelemetry Collector

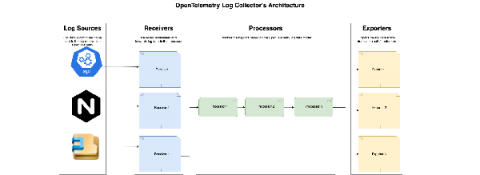
Our log agent is powerful, efficient, and highly adaptable. Now, with OpenTelemetry setting new standards in the observability space, we wanted to incorporate that collaboration into our log agent and offer our users the ability to take advantage of the OpenTelemetry ecosystem. Starting today, you can upgrade the log agents in your observIQ account to the new Open Telemetry-based observIQ log agent with a single click.