Operations | Monitoring | ITSM | DevOps | Cloud
Latest News
Elevate your event data with Custom Data Enrichment in Coralogix
Have you ever found yourself late at night combing through a myriad of logs attempting to determine why your cluster went down? Yes, that’s a really stressful job, especially when you think about how much money your company loses as a result of these incidents. Gartner estimates that the revenue lost due to outages is around $5,600/minute, which amounts to more than $330K/hour.
What's New in the Splunk Dataflow Template
The Splunk Dataflow template is an indispensable tool that allows Google Cloud customers to easily engineer a horizontally scalable and fault-tolerant logging export pipeline into Splunk® Enterprise and Splunk Cloud Platform™.
New Solutions to New Observability Needs
“Observability,” is the process in DataOps of recording data generated by digital systems as they go about their processes. There are some great companies in the observability space, generating a whopping $17 billion annually, and contributing a significant portion to the modest 2.5 quintillion bytes of data created every year.
Ship Logs from Docker with the Logz.io Fluentd Proxy
The past year has been significant for continued development of both DevOps practices and new developments across the open source community. To that end, Logz.io is moving forward with renewed support for the Fluentd log shipper. This new proxy will serve as an alternative to Filebeat and Logstash, which recently moved away from open source licensing. Additionally, this integration utilizes an HTTP proxy instead of the SOCKS5 proxy necessary for Filebeat.
How to Troubleshoot Apache Cassandra Performance Using Metrics and Logs in Debugging
The Top 50 ELK Stack & Elasticsearch Interview Questions
If you are a candidate looking for your next role that involves an in-depth knowledge of Elasticsearch and the wider Elastic Stack then you will want to revise beforehand. In this resource guide on the top ELK interview questions, we've listed all of the leading questions that candidates are commonly asked about Elasticsearch, Logstash & Kibana (and their contemporary tools and plugins) alongside the answers. Want to improve your knowledge further?
Monitor and troubleshoot your VMs in context for faster resolution
Troubleshooting production issues with virtual machines (VMs) can be complex and often requires correlating multiple data points and signals across infrastructure and application metrics, as well as raw logs. When your end users are experiencing latency, downtime, or errors, switching between different tools and UIs to perform a root cause analysis can slow your developers down.
Making the LogDNA UI more accessible
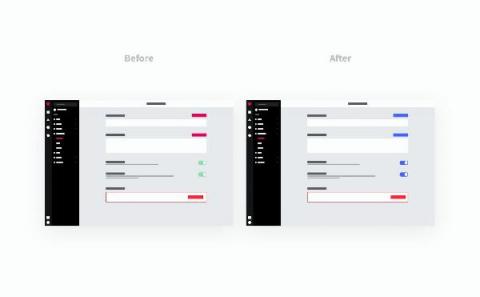
I’m Tim, a Product Design Manager at LogDNA and a massive coffee and magic enthusiast. My team is responsible for creating a beautiful and easy-to-navigate user interface so that you can easily access, and gain value from, your logs. We’ve been working on making our product more accessible and are about to roll out some subtle changes.
Read active log files more quickly and easily with the new filestream input in Filebeat
With Elastic 7.14, the filestream input, the successor of log input, is now generally available in Filebeat. This new, superior input provides better support for reading active log files, with faster reaction time when there is backpressure in the system, quicker registry updates, better cooperation with external log rotation tools, and more.


