Operations | Monitoring | ITSM | DevOps | Cloud

Latest News

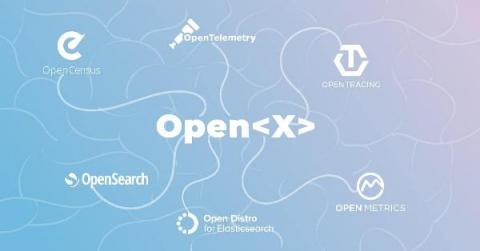
Quick Dictionary to Open<X> Projects in Observability

Do you also find yourself confused by all the Open-this and Open-that names flying around? There are currently a good few Open projects, standards, tools – OpenTelemetry, OpenTracing, OpenCensus, OpenSearch… heck, even my podcast is called OpenObservability! And new Open names seem to be popping up every other day. If you too feel this way, there’s no need. Many feel similarly confused.

Logit.io Confirms Plans To Support AWS OpenSearch & OpenDashboards

We are excited to inform all of our users that we will be bringing OpenSearch and OpenDashboards onto the Logit.io platform in the coming months. You may have already been aware that we’ve previously announced our support for the previous iteration of OpenSearch & OpenDashboards known as Open Distro in our response here. Due to our early public support of these oncoming changes you can see our platform cited on the official AWS OpenSearch website.

Discover VirtualMetric Reader - Full Automation and AI-based Log Processing and Analysis

VirtualMetric presents a new feature as part of our Log Tracking Suite – VirtualMetric Log Reader. The new capability of the product connects to any device within your IT infrastructure, collects the log information, parses it and transforms it into easy to analyse charts and graphs. No need to add any data sources or to read logs manually.

How to Maximize the Performance of Your Kubernetes Deployment

With Kubernetes emerging as a strong choice for container orchestration for many organizations, monitoring in Kubernetes environments is essential to application performance. Poor application/infrastructure performance impact in the era of cloud computing, as-a-service delivery models is more significant than ever. How many of us today have more than two rideshare apps or more than three food delivery apps?

What Is Network Latency: Complete Guide on How to Check, Measure and Reduce It to Improve Performance

So you finally launched your service worldwide, great! The next thing you’ll see is thousands and thousands of people flooding into your amazing website from all corners of the world expecting to have the same experience regardless of their location. Here is where things get tricky. Having an infrastructure that will support the expansion of your service across the globe without sacrificing user experience is going to be real though as distance will introduce latency.

Announcing the GA of the LogDNA Configuration API and LogDNA Terraform Provider

We’re excited to announce that our Configuration API and Terraform Provider are now generally available for all LogDNA customers. We received tremendous feedback from our public beta release and, based on that feedback, we are enabling several new features with the GA release that allow for more programmatic workflows with LogDNA. First, we are enabling Preset Alerts as a new resource that can be configured with the configuration API as well as within Terraform.

The Top 21 Grafana Dashboards & Visualisations

In our guide on the best Grafana dashboards examples, we wanted to show you some of the best ways you can use Grafana for a variety of different use cases across your organisation. Whether you are a software architect or a lead DevOps engineer, Grafana is used to make analysis and data visualisation far easier to conduct for busy engineering and technical teams throughout the world.

Why Cloud-Native SIEM?

The SIEM is a central point where data is collected and correlated, and as we move to consume more cloud services and data sets the SIEM itself must also change in architecture. Architecture change is hard to make for existing products. Calling a product a ‘cloud solution’ is not the same as taking an on-premises product and hosting it for customers. It means building a new SIEM for a new world. There are a lot of reasons users seek new SIEMs.

Logging and Monitoring: A Match Made in Software Heaven

All code and no logging makes your application a black box system. Similarly, all logging and no monitoring makes analyzing performance complicated and inconvenient. The goal is to achieve better visibility into the operations of your application, its status, performance, and overall health. Making this information easily accessible presents more context about the critical incidents and surfaces actionable insights for optimizing performance.

Announcing our $55M Series C Round Funding to further our storage-less data vision

It’s been an exciting year here at Coralogix. We welcomed our 2,000th customer (more than doubling our customer base) and almost tripled our revenue. We also announced our Series B Funding and started to scale our R&D teams and go-to-market strategy. Most exciting, though, was last September when we launched Streamaⓒ – our stateful streaming analytics pipeline. And the excitement continues!