Operations | Monitoring | ITSM | DevOps | Cloud

Latest News

Data Lake Opportunities: Rethinking Data Analytics Optimization [VIDEO]

Data lakes have challenges. And until you solve those problems, efficient, cost-effective data analytics will remain out of reach. That’s why ChaosSearch is rethinking the way businesses manage and analyze their data. As Mike Leone, Senior Analyst for Data Platforms, Analytics and AI at ESG Global, and Thomas Hazel, ChaosSearch’s founder and CTO, explained in a recent webinar, ChaosSearch offers a data analytics optimization solution that makes data faster and cheaper to store and analyze.

Data Lake Challenges: Or, Why Your Data Lake Isn't Working Out [VIDEO]

Since the data lake concept emerged more than a decade ago, data lakes have been pitched as the solution to many of the woes surrounding traditional data management solutions, like databases and data warehouses. Data lakes, we have been told, are more scalable, better able to accommodate widely varying types of data, cheaper to build and so on. Much of that is true, at least theoretically.

Which Event Log Events Should You Worry About?

When you are configuring your event log monitor settings, you need to decide which event log events you need to worry about. Event logs are generated for a wide array of processes, applications, and events. Logs will record both successes and failures. As such, you need to decide what data is most vital and needs your immediate attention.

Why We Chose the M3DB Data Store for Logz.io Prometheus-as-a-Service

Logz.io is focused on creating the best observability service to manage the scale of monitoring, add value on top of AI/ML technologies, and enhance enterprise security. Metrics is one of the pillars of Logz.io, and our Prometheus-as-a-Service offering. It has been a crucial part of our platform goals, but if we turn the clocks back a year, our service only used the open-source Elasticsearch database (ES).

Finding the Bug in the Haystack: Hunting Down Exceptions in Production

Software companies are in a constant pursuit to optimize their delivery flow and increase release velocity. But as they get better at CI/CD in the spirit of “move fast and break things,” they are also being forced to have a very sobering conversation about “how do we fix all those things we’ve been breaking so fast?” As a result, today’s cloud-native world is fraught with production errors, and in dire need of observability.

Monitoring Logs for Insider Threats During Turbulent Times

For logs and tracking insider threats, you need to start with the relevant data. In these turbulent times, IT teams leverage centralized log management solutions for making decisions. As the challenges change, the way you’re monitoring logs for insider threats needs to change too. Furloughs, workforce reductions, and business practice changes as part of the COVID stay-at-home mandates impacted IT teams.

Directly search S3 with the new frozen tier

We’re thrilled to announce the technical preview of the frozen tier in 7.12, enabling you to completely decouple compute from storage and directly search data in object stores such as AWS S3, Microsoft Azure Storage, and Google Cloud Storage. The next major milestone in our data tier journey, the frozen tier significantly expands your data reach by storing massive amounts of data for the long haul at much lower cost while keeping it fully active and searchable.

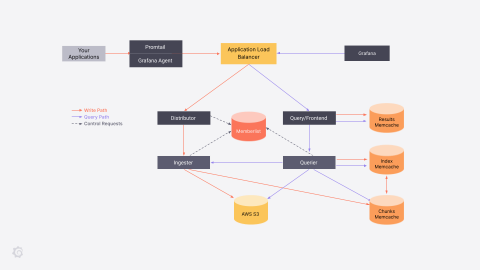
How I fell in love with logs thanks to Grafana Loki

As part of my job as a Senior Solutions Engineer here at Grafana Labs, I tend to pretty easily find ways out of technical troubles. However, I was recently having some Wi-Fi issues at home and needed to do some troubleshooting. My experience changed my whole opinion on logs, and I wanted to share my story in hopes that I could open up some other people’s eyes as well. (I originally posted a version of this story on my personal blog in January.) First, some background info.

High throughput VM logging and metrics agent now in Preview

Running and troubleshooting production services requires deep visibility into your applications and infrastructure. Virtual machines running on Google Compute Engine (GCE) provide some system logs and metrics without any configuration required, but capturing application and advanced system data has required the installation of both a metrics agent and a logging agent.

Uniting Tracing and Logs With OpenTelemetry Span Events

The current landscape of what our customers are dealing with in monitoring and observability can be a bit of a mess. For one thing, there are varying expectations and implementations when it comes to observability data. For another, most customers have to lean on a hodgepodge of tools that might blend open source and proprietary, require extensive onboarding as team members have to learn which tools are used for what, and have a steep learning curve in general.