Operations | Monitoring | ITSM | DevOps | Cloud
Latest News
Finding Unexpected Development Solutions Through Log Management
This is a personal story from before I worked at observIQ. I am not a technical person in any professional sense. I have no direct training and my coding experience is limited to front-end web design and some indie game development. Before observIQ, all I knew about log management was that it has something to do with tracking computer performance and behavior, and I associated it mostly with DevOps and the cloud. I never imagined it would play any valuable role in my professional endeavors.
The Ops Agent is now GA and it leverages OpenTelemetry
Running and troubleshooting production services requires deep visibility into your applications and infrastructure. While basic logs and metrics are available out of the box with Google Cloud Compute Engine (GCE), capturing advanced data used to require the installation of both a metrics agent and a logging agent.
How to mitigate DevOps tool sprawl in enterprise organizations
There’s an insidious disease increasingly afflicting DevOps teams. It begins innocuously. A team member suggests adding a new logging tool. The senior dev decides to upgrade the tooling. Then it bites. You’re spending more time navigating between windows than writing code. You’re scared to make an upgrade because it might break the toolchain. The disease is tool sprawl.
Graylog Illuminate: Getting Started with Sysmon
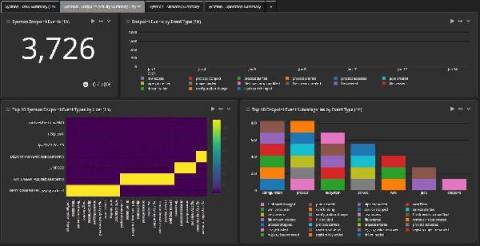
The Windows System Monitor (Sysmon) is one of the chattiest tools. With all the information coming in, it can be difficult and expensive to use it efficiently. However, the Graylog Illuminate package gives you a way to fine-tune it so that you can get better data and manage your ingestion rate better. Sysmon gives you awareness of what’s going on in your endpoints.
A Guide to Monitoring AWS Lambda Metrics with Prometheus & Logz.io
In this post we will discuss some key considerations and strategies to monitor your AWS Lambda functions. This will include: which Lambda metrics you’ll want to monitor, how to collect AWS Lambda metrics with Prometheus and Logz.io, how to create a monitoring dashboard with alerts, and how to search and visualize your metrics.
The Business Case for Switching from the ELK Stack
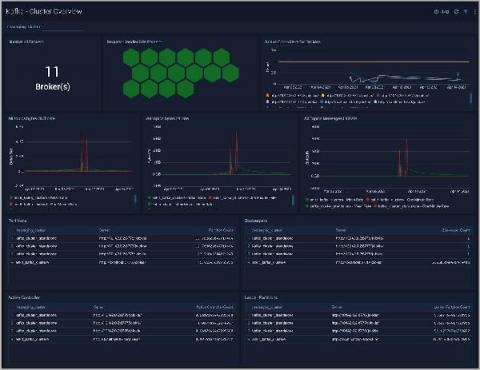
Monitoring Apache Kafka Clusters with Sumo Logic
Create alerts from your logs, available now in Preview
Being alerted to an issue with your application before your customers experience undue interruption is a goal of every development and operations team. While methods for identifying problems exist in many forms, including uptime checks and application tracing, alerts on logs is a prominent method for issue detection. Previously, Cloud Logging only supported alerts on error logs and log-based metrics, but that was not robust enough for most application teams.
Intro to AIOps: Leveraging AI and Machine Learning in DevOps
AIOps is a DevOps strategy that brings the power of machine learning to bear on observability and system management. It’s not surprising that an increasing number of companies are now adopting this approach. AIOps first came onto the scene in 2015 (coincidentally the same year as Coralogix) and has been gaining momentum for the past half-decade. In this post, we’ll talk about what AIOps is, and why a business might want to use it for their log analytics.


