Operations | Monitoring | ITSM | DevOps | Cloud
Latest News
How to do network traffic analysis with VPC Flow Logs on Google Cloud
Network traffic analysis is one of the core ways an organization can understand how workloads are performing, optimize network behavior and costs, and conduct troubleshooting—a must when running mission-critical applications in production. VPC Flow Logs is one such enterprise-grade network traffic analysis tool, providing information about TCP and UDP traffic flow to and from VM instances on Google Cloud, including the instances used as Google Kubernetes Engine (GKE) nodes.
Customize your LogDNA Webhook Alerts
LogDNA Alerts are a key feature for developers and SREs to stay on top of their systems and applications, as it notifies them of important changes in their log data. However, with so many different workflows to account for, it was important to enable a flexible solution that could connect to any team’s toolkit.
Executive Orders, Graylog, and You
In the last six months, multiple major cyber attacks have severely impacted hundreds of organizations in both the public and private sectors, and disrupted the daily lives of tens of thousands of their employees and customers.
Log Management and SIEM Overview: Using Both for Enterprise CyberSecurity
Distributed Tracing vs. Application Monitoring
What's New: Splunk Enterprise 8.2
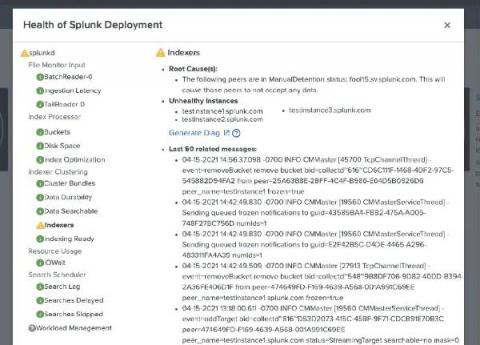
Welcome back to another day in paradise. Today we are announcing the release of Splunk Enterprise 8.2. Since our last release of Splunk Enterprise 8.1 at .conf20, we have continued development of new and enhanced capabilities for our twice a year release cadence. In Splunk Enterprise 8.2, we have focused our development offers across a number of themes: insights, admin productivity, data infrastructure, and performance.
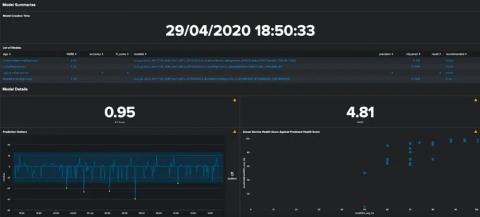
Monitoring Model Drift in ITSI
I’m sure many of you will have tried out the predictive features in ITSI, and you may even have a model or two running in production to predict potential outages before they occur. While we present a lot of useful metrics about the models’ performance at the time of training, how can you make sure that it is still generating accurate predictions? Inaccuracy in models as the underlying data or systems change over time is natural.
How to correlate Graphite metrics and Loki logs
Grafana Explore makes correlating metrics and logs easy. Prometheus queries are automatically transformed into Loki queries . And we will be extending this feature in Grafana 8.0 to support smooth logs correlation not only from Prometheus, but also from Graphite metrics. Prometheus and Loki have almost the same query syntax, so transforming between them is very natural. However, Graphite syntax for queries is different, and in order to map it to Loki, some extra setup is required.
Monitor Cloudflare logs and metrics with Datadog
Cloudflare is a content delivery network (CDN) that organizations across industries use to secure the reliability of their websites, applications, and APIs. With a wide array of security, networking, and performance-management tools, millions of web applications employ Cloudflare’s DDoS protection, load balancing, and serverless compute-monitoring features to maintain high performance and uptime.


