Operations | Monitoring | ITSM | DevOps | Cloud

Latest News

Debugging with Dashbird: Lambda not logging to CloudWatch

Lambda not logging to CloudWatch? It’s actually one of the most common issues that come up. Let’s briefly go over why this problem needs to be solved. CloudWatch is the central logging and monitoring service of the AWS cloud platform. It gives you insights into all the AWS services. Even if you can’t deploy and test serverless systems locally, CloudWatch tells you what’s happening to them.

What is the Coralogix Security Traffic Analyzer (STA), and Why Do I Need It?

The wide-spread adoption of cloud infrastructure has proven to be highly beneficial, but has also introduced new challenges and added costs – especially when it comes to security. As organizations migrate to the cloud, they relinquish access to their servers and all information that flows between them and the outside world. This data is fundamental to both security and observability.

Stream Your AWS Services Metrics to Splunk

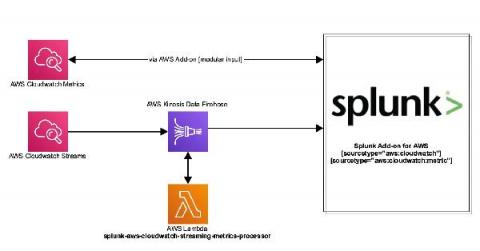
Amazon Web Services (AWS) recently announced the launch of CloudWatch Metric Streams. Cloudwatch Streams can stream metrics from a number of different AWS resources using Amazon Kinesis Data Firehose to target destinations. The new service is different from the current architecture. Instead of polling, metrics are delivered via an Amazon Kinesis Data Firehose stream. This is a highly scalable and far more efficient way to retrieve AWS service metrics.

Introducing Browser Logger - Unlocking the Power of Frontend Logs

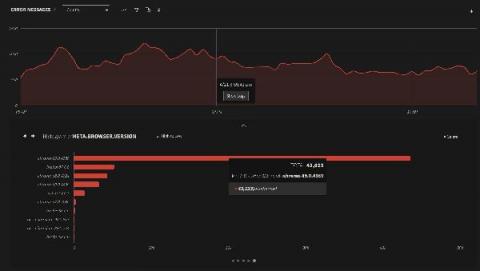
Modern web applications are more reliant on the frontend than ever before. While there are many benefits to this approach, one downside is that developers can lose visibility into issues when things go wrong. When the application experience is degraded, engineers are left waiting for users to report issues and share browser logs. Otherwise, they might be left in the dark and unaware that any issues exist in the first place.

How to search logs in Loki without worrying about the case

Whether it’s during an incident to find the root cause of the problem or during development to troubleshoot what your code is doing, at some point you’ll have an issue that requires you to search for the proverbial needle in your haystack of logs. Loki’s main use case is to search logs within your system. The best way to do this is to use LogQL’s line filters. However, most operators are case sensitive.

From Distributed Tracing to APM: Taking OpenTelemetry & Jaeger Up a Level

It’s no secret that Jaeger and OpenTelemetry are known and loved by the open source community — and for good reason. As part of the Cloud Native Computing Foundation (CNCF), they offer one the most popular open source distributed tracing solutions out there as well as standardization for all telemetry data types.

The Value of Ingesting Firewall Logs

In this article, we are going to explore the process of ingesting logs into your data lake, and the value of importing your firewall logs into Coralogix. To understand the value of the firewall logs, we must first understand what data is being exported. A typical layer 3 firewall will export the source IP address, destination IP address, ports and the action for example allow or deny. A layer 7 firewall will add more metadata to the logs including application, user, location, and more.

The essentials of central log collection with WEF and WEC

Last week we covered the essentials of event logging: Ensuring that all your systems are writing logs about the important events or activities occurring on them. This week we will cover the essentials of centrally collecting these Event Logs on a Window Event Collector (WEC) server, which then forwards all logs to Elastic Security.