Operations | Monitoring | ITSM | DevOps | Cloud

Latest News

Kibana Canvas: An In-Depth Guide

When we look at information, numbers, percentages, statistics, we tend to have an easier time understanding and interpreting them if they’re also represented by corresponding visual cues. Kibana Canvas is a tool that helps us present our Elasticsearch data with infographic-like dashboards – fully visual, dynamic, and live.

Best Practices for Logging in Kotlin

If you’re reading this, you have probably been convinced that taking on Kotlin for your mobile application is the most sensible choice. Now that you’ve come to this decision, it’s imperative to know what you need to do to stay on top of your monitoring and logging. Like with any application or system, they are essential, cornerstone qualities of any successful project.

Something Else To Be Thankful For: Splunk Security Essentials 3.2.2

Well, it’s been a while since you read a blog dedicated to the latest release – okay, the latest several releases – of Splunk Security Essentials (SSE). We have been busy behind the scenes, however, so let’s catch you up on SSE’s latest features, which include the new version of our content API, and externally with updates from MITRE and the release of ATT&CK v7.2 (with Sub-Techniques) and ATT&CK v8.

Monitoring Microsoft SQL Best Practices

For decades, Microsoft SQL has been a leading relational database solution within Windows-based environments. The extension of Microsoft SQL support to Linux servers in 2017 made the platform even more popular. There’s a good chance that, no matter which types of infrastructure or servers you manage, there are Microsoft SQL databases residing somewhere on them. That’s why it’s critical to understand the fundamentals of Microsoft SQL monitoring.

How JetBrains uses .NET, Elasticsearch, CSVs, and Kibana for awesome dashboards

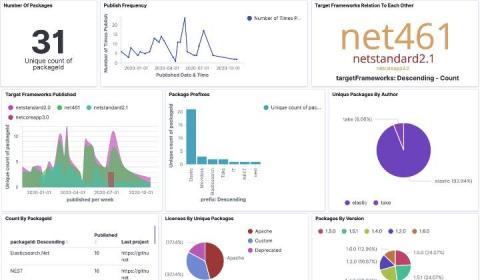
Recently, the JetBrains .NET advocacy team published a deep-dive post powered by data we retrieved from the official NuGet APIs with the goal of better understanding our community's OSS past and trying to predict trends into the future. This resulted in a giant dataset. Given our experience with Elasticsearch, we knew that the best tool to process millions of records was what we're calling the NECK stack: .NET, Elasticsearch, CSV, and Kibana.

Beginner's Guide to Jaeger + OpenTracing Instrumentation for Go

This post aims to provide a very simple beginner’s guide to Jaeger + OpenTracing instrumentation for Go applications (the terms “application” and “service” is used interchangeably in this document) via a working example. If you are new to instrumentation, I recommend that you first read this post for a practical introduction to instrumentation for Jaeger and OpenTracing. You can also get more info on using logs in Go.

Splunk Infrastructure Monitoring is AWS Outposts Ready

We are excited to announce that Splunk Infrastructure Monitoring has achieved Outposts Ready designation. This designation recognizes that Splunk provides proven solutions for customers to build, manage and run hybrid cloud applications. AWS Outposts Ready designation establishes Splunk as an AWS Partner Network (APN) member that provides validated integrations with a specific focus on observability and monitoring of AWS Outposts deployments.

Onboard your tracing data to Sumo Logic even faster with AWS OpenTelemetry distro (preview)

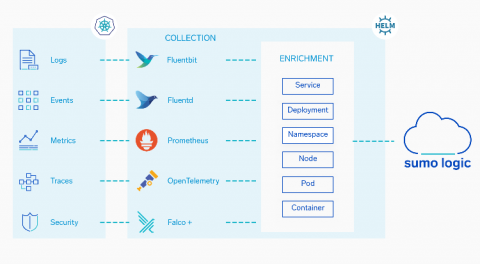
We at Sumo Logic believe in an open, flexible, community-driven approach to collecting observability data. Those reasons are outlined in one of my recent blogs. In that publication, I share the belief that an application’s observability gains traction from the fact that telemetry signals are designed, composed, and produced by an application developer/vendor in compliance with industry standards, and are not a proprietary, black box component of the monitoring vendor.

Getting started with Elastic Cloud on AWS

Elastic on Amazon Web Services (AWS) gives you the power of Elastic Enterprise Search, Elastic Observability, Elastic Security as well as the Elastic Stack. You can quickly and easily search your environment for information, analyze data to observe insights, and protect your technology investment. Elastic Cloud lets you deploy your way, whether as a managed service or with orchestration tools you manage in the cloud.