Operations | Monitoring | ITSM | DevOps | Cloud

Latest News

Investigative analysis of disjointed data in Elasticsearch with the Siren Platform

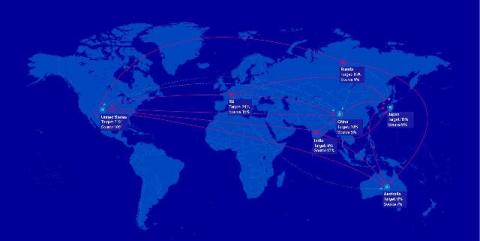
At Siren, we build a platform used for “investigative intelligence” in Law Enforcement, Intelligence, and Financial Fraud. Investigative intelligence is a specialisation of data analytics that serves the needs of those that are typically hunting for bad actors. Such investigations are the primary focus of law enforcement and intelligence, but are also critical to uncovering financial crime activities and for threat hunting in cybersecurity.

Log Analysis: What Is It and How Does It Work?

If you work in Information Technology, you have doubtless encountered logs- in fact depending on your area of expertise, you may be inundated with them on a daily basis. Nearly every piece of digital technology produces some kind of log, from complex web applications to the drivers that power your mouse and keyboard. As such, the definition of what a “log” actually is, is necessarily loose; any output received from a piece of software could be considered a log.

Kibana Visualization How-to's: Heatmaps

In Kibana you have a full selection of graphical representations for your data, most of the time this can be a simple line or bar charts to do what you need to do. But every so often you need to take a different view to get the most out of your data. Heatmaps are a critical component of the Kibana visualization arsenal, and deserve their own attention.

AWS Elasticsearch Pricing: Getting Cost Effective Logging as You Scale

AWS Elasticsearch is a common provider of managed ELK clusters., but does the AWS Elasticsearch pricing really scale? It offers a halfway solution for building it yourself and SaaS. For this, you would expect to see lower costs than a full-blown SaaS solution, however, the story is more complex than that.

Observability 101: Terminology and Concepts

When I first started following Charity on Twitter back in early 2019, I was quickly overwhelmed by the new words and concepts she was discussing. I liked the results she described: faster debugging, less alert fatigue, happier users. Those are all things I wanted for my team! But I was hung up on these big polysyllabic words, which stopped me from taking those first steps toward improving our own observability.

Monitoring Google Cloud with the Elastic Stack and Google Operations

Google Operations suite, formerly Stackdriver, is a central repository that receives logs, metrics, and application traces from Google Cloud resources. These resources can include compute engine, app engine, dataflow, dataproc, as well as their SaaS offerings, such as BigQuery. By shipping this data to Elastic, you’ll get a unified view of the performance of resources across your entire infrastructure from cloud to on-prem.

Detecting & Preventing Ransomware Through Log Management

As companies responded to the COVID-19 pandemic with remote work, cybercriminals increased their social engineering and ransomware attack methodologies. Ransomware, malicious code that automatically downloads to a user’s device and locks it from further use, has been rampant since the beginning of March 2020. According to a 2020 report by Bitdefender, ransomware attacks increased by seven times when compared year-over-year to 2019.

Logging Golang Apps with ELK and Logz.io

The abundance of programming languages available today gives programmers plenty of tools with which to build applications. Whether long-established giants like Java or newcomers like Go, applications need monitoring after deployment. In this article, you will learn how to ship Golang logs to the ELK Stack and Logz.io. It’s usually possible to get an idea of what an application is doing by looking at its logs. However, log data has a tendency to grow exponentially over time.

Can Distributed Tracing Replace Logging?

Logging has been around since programming began. We use logs to debug issues and understand how software works at the code level. After logging and debuggers, profilers are a dev’s best friend when writing code and may run in production with limits to reduce overhead. As we distributed architectures — making systems more complex — centralized log aggregation was soon necessary. At that point, we had to analyze this data. Hence, log analytics technologies were born.